Class Central is learner-supported. When you buy through links on our site, we may earn an affiliate commission.

Coursera

Data Analytics for Lean Six Sigma

University of Amsterdam via Coursera

Overview

Welcome to this course on Data Analytics for Lean Six Sigma. 
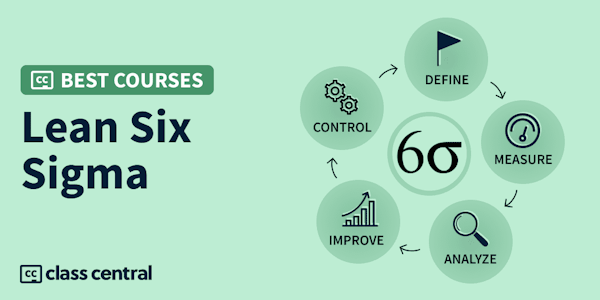
In this course you will learn data analytics techniques that are typically useful within Lean Six Sigma improvement projects. At the end of this course you are able to analyse and interpret data gathered within such a project. You will be able to use Minitab to analyse the data. I will also briefly explain what Lean Six Sigma is. I will emphasize on use of data analytics tools and the interpretation of the outcome. I will use many different examples from actual Lean Six Sigma projects to illustrate all tools. I will not discuss any mathematical background. The setting we chose for our data example is a Lean Six Sigma improvement project. However data analytics tools are very widely applicable. So you will find that you will learn techniques that you can use in a broader setting apart from improvement projects. I hope that you enjoy this course and good luck! Dr. Inez Zwetsloot & the IBIS UvA team

Syllabus

  • Data and Lean Six Sigma
    • This module introduces Lean Six Sigma and shows you where data and data analytics have their place within the DMAIC framework. It also introduces the software package Minitab. This package is used throughout the videos for data analytics. It is not mandatory to use this package. I just really like it!
  • Understanding and visualizing data
    • This module explains how to visualize data. It discusses visualizing single variables as well as visualizing two variables. You will learn to select the appropriate graph. For this it is essential to first learn the distinction between numerical and categorical data.
  • Using probability distributions
    • In this module on using probability distributions, you will learn how to quantify uncertainty. Furthermore you will learn to answer an important business question: “what percentage of products or cases meet our specifications?".
  • Introduction to testing
    • You will learn to model your CTQ and influence factor(s) and to use a decision tree to select the appropriate tool for data based testing of this model. Furthermore, causality is introduced.
  • Testing: numerical Y and categorical X
    • In this module on statistical testing, you will learn how to establish relationship between a numerical Y variable (the CTQ) and categorical influence factors (the X variables).
  • Testing: numerical Y and numerical Y
    • What is the relation between the length of stay and the age of a patient? In this module you will learn to answers these types of questions using statistical tests to relate a numerical CTQ (the Y variable) to a numerical influence factor (the X variable).
  • Testing: categorical Y
    • Finally you will learn how to test a relationship between a Y and a X variable whenever your Y variable (the CTQ) is a categorical variable.

Taught by

Inez Zwetsloot

Reviews

4.8 rating at Coursera based on 3211 ratings

Start your review of Data Analytics for Lean Six Sigma

Never Stop Learning.

Get personalized course recommendations, track subjects and courses with reminders, and more.

Someone learning on their laptop while sitting on the floor.