10 Best pandas Courses to Take in 2024
Unlock the power of data analysis with the top pandas courses. Pandas is a powerful, open-source Python library.

Pandas is a powerful, open-source Python library designed for data manipulation and analysis, enabling you to seamlessly clean, transform, and visualize data with just a few lines of code.
It is the most important data science library after NumPy, with over a half of Python developers using it for data science tasks.
With Pandas, you can easily read, write, and manipulate data in various formats such as CSV, Excel, SQL databases, and more. You can also perform various operations such as filtering, grouping, merging, and reshaping data with ease. It’s a must-have tool for any data scientist or analyst!
In this ranking, we’ve gathered and ranked top-notch pandas courses for all levels of Python programmers — from beginners just starting out to advanced programmers with experience to show —to teach you how to handle data like a pro. Unlock a world of possibilities in the data-driven world we live in with these courses!
Here are my top picks. Click on one to skip to the course details:
| Course | Workload | In Brief |
| 1. Python and Pandas for Data Engineering (Duke University) | 24–36 hours | Best free video course for anyone with no experience with Python |
| 2. Python Pandas For Your Grandpa (GormAnalysis) | 2–3 hours | Best free video course for Python programmers with hands-on exercises |
| 3. Pandas (Kaggle) | 4 hours | Best free text-based course for Python programmers with hands-on exercises |
| 4. Data Manipulation with pandas (DataCamp) | 4 hours | Best video course for Python programmers with interactive quizzes and exercises |
| 5. Advanced Pandas (LinkedIn Learning) | 1 hour | Best video course for advanced pandas users with hands-on exercises |
| 6. Analíticas de Datos con Pandas (Tecnológico de Monterrey) | 25 hours | Best free in-depth video course for Spanish speaking Python programmers |
| 7. Solving Real-World Data Science Interview Questions! (with Python Pandas) (Keith Galli) | 1–2 hours | Best free video course for intermediate Python programmers preparing for data science positions |
| 8. Pandas Workshop (Stefanie Molin) | N/A | Best free Jupyter notebook-based course for Python programmers |
| 9. Joyful Pandas (Yuanhao Geng) | N/A | Best free text-based course for Chinese-speaking Python programmers |
| 10. Pandas cookbook (Julia Evans) | N/A | Best free Jupyter notebook-based crash course for Python programmers |
What is pandas?
Pandas is an open-source Python library for handling and manipulating huge, complex real-world datasets. Contrary to what you may have believed, pandas is not named after the animal but a much more boring term, panel data (don’t ask me where the letter S in pandas comes from). It’s like the Swiss Army knife for data science — it has a lot of ready-made tools (from data preprocessing to analysis), it’s very versatile (you can make your own functions), and it’s a must-have for anyone working with structured data (really!).
Originally designed out of need for intensive quantitative analysis on financial data, pandas has since expanded in scope and excels in handling mixed data types, missing values, and data alignment thanks to two handy data structures: DataFrame and Series. A DataFrame is basically a very fancy spreadsheet, being two-dimensional, one-data-type-only data structure in table form with rows and columns. On the other hand, a Series is the opposite of a table — it is a one-dimensional array-like structure or list that can hold any data type and serves as the building block for DataFrames. These data structures combined form a formidable team.
With half of Python developers using pandas for data science (according to the 2022 State of Python survey), pandas has established itself as one of the most widely used Python libraries for data manipulation and analysis. As a result, Pandas has become a key component in the Python data science ecosystem, alongside other prominent libraries such as SciPy, TensorFlow, scikit-learn, and Matplotlib.
Additionally, pandas offers a plethora of built-in functions for data cleaning, aggregation, transformation, filtering, and time series analysis, making it an indispensable tool for data scientists and analysts alike.
Best Courses Guides Methodology
I built this ranking following the now tried-and-tested methodology used in previous Best Courses Guides (you can find them all here). It involves a three-step process:
- Research: I started by leveraging Class Central’s database with 100K online courses and 200K+ reviews. Then, I made a preliminary selection of 125+ panda courses by rating, reviews, and bookmarks.
- Evaluate: I read through reviews on Class Central, Reddit, and course providers to understand what other learners thought about each course and combined it with my own experience as a learner.
- Select: Well-made courses were picked if they presented valuable and engaging content and they have to fit in a set of criteria and be ranked accordingly: comprehensive curriculum, affordability, release date, ratings and enrollments.
Course Ranking Statistics
Here are some aggregate stats about the ranking:
- Only one course in this ranking is suitable for complete beginners, two are for intermediates, one for advanced, and the rest for beginners.
- All of the courses except for two are free or free-to-audit.
- Most of the courses are video-based.
- Two of the courses are produced by universities, two by institutions, and the rest by independents.
1. Python and Pandas for Data Engineering (Duke University)

My first pick for the best pandas course is Python and Pandas for Data Engineering from Duke University.
Do you have no experience with Python (or even programming for that matter) whatsoever? Then this free-to-audit course is for you! It’ll not only teach you the Python and pandas programming skills, but also the other tools needed to manage code and build scalable projects as a data or machine learning engineer. And with lots of exercises and labs prepared to help you practice what you’ve learned, it is easy to see why this course is my number one pick!
You’ll first cover the basics of Python like simple and compound statements along with data structures such as sequences, dictionaries, and generators. Then, you’ll explore manipulating data with pandas’ DataFrame, before finally ending with an overview of some popular development environments (such as Vim and Visual Studio) as well as version control.
This course is valuable for beginning and intermediate students in order to start transforming and manipulating data as a data engineer.
What You’ll Learn
This course is divided into four weeks: Getting Started with Python; Essential Python; Data in Python: Pandas and Alternatives; Python Development Environments.
In the first week of the course, you’ll get ready to program in Python by setting up, installing, and importing third-party libraries into an isolated Python environment. Then, you’ll get a feel for how interactive the data science programming workflow is by writing and executing Python statements individually in a Jupyter notebook.
After practicing the basics of Python programming like variables and control flow, you’ll dive into the essential concepts and data structures in Python: Sequences, Dictionaries, Sets, List Comprehensions, and Generators. You’ll learn when and how to use each of these concepts to solve real-world problems.
Now that you have a firm grasp on Python, it’s time to experiment with pandas ! You’ll learn how to create and load data into pandas DataFrames — an Excel-like data structure with rows and columns. Then, you’ll learn how to select and manipulate these DataFrames by filtering data and applying functions over them. Additionally, you’ll explore and compare alternatives to pandas such as NumPy and Dask.
The final week of this course will teach you the tools you need to become an actual developer. You’ll learn how to speed up your editing workflow with Vim, a keyboard-based editor, and manage large projects with Visual Studio Code, a rich feature-packed text editor. And when working in a team, you’ll learn how to collaborate with one another by using Git, a version control system that keeps track of changes in a codebase.
How You’ll Learn
This course is 4 weeks long, with each week taking 6–9 hours of study. For those taking this course for free, you’ll learn mainly by watching the excellently-produced lecture video and practice quizzes.
If you’re a verified learner, you’ll have access to the labs. These labs put you in a hands-on learning environment where you’ll complete the projects tasked. You’ll need to pass all graded assignments to complete the course and get the certificate.
| Institution | Duke University |
| Provider | Coursera |
| Instructor | Kennedy Behrman, Alfredo Deza, and Noah Gift |
| Level | Beginner |
| Workload | 24–36 hours |
| Enrollments | 10K |
| Rating | 4.5 / 5.0 (112) |
| Certificate | Paid |
Fun Facts
- The course has 251 bookmarks on Class Central.
- This course is the first course in the Python, Bash and SQL Essentials for Data Engineering Coursera specialization. If you enjoy this course, you should take the rest of the specialization, where you’ll cover Bash scripting, SQL, web scraping, web development, and more!
- Kennedy Behrman is a Senior Data Engineer at Envestnet, a financial technology corporation for wealth management.
- Alfredo Deza is Principle Cloud Advocate at Microsoft. Previously, he has worked at companies like Red Hat and Inktank.
- Noah Gift is an Executive in Residence and Founder of Pragmatic AI Labs. He teaches and designs graduate machine learning at Duke University and has written several books, including Practical MLOps, Python for DevOps, and Pragmatic A.I.
If you’re interested in this course, you can find more information about the course and how to enroll here.
2. Python Pandas For Your Grandpa (GormAnalysis)

My second pick for the best pandas course is Python Pandas For Your Grandpa — so easy that you grandpa could learn it!
In this free course you’ll cover the important aspects of pandas like reading and writing data to a file, creating data, merging data, grouping data, and so on. You’ll learn through animations and practical problems and examples to help you learn intuitively.
To take this course, you should have a basic understanding of Python (data types, lists, sets, and lambda functions) and optionally, NumPy.
What You’ll Learn
This course is divided into 5 sections: Introduction; Series; DataFrame; Advanced; and Final Boss.
You’ll begin this course by first getting an overview of the pandas library, its purpose, and its benefits in data manipulation and analysis.
Then, you’ll study the most fundamental data structure in pandas called the Series. As its name suggests, it’s a one-dimensional array-like structure. It has indexes which allow you to access and modify elements in it. You’ll learn the many useful operations you can perform on a series, like vectorizing, filtering elements, applying functions, and so on. You’ll also learn how to deal with pesky missing values in a series.
The big brother of the Series is the DataFrame, a two-dimensional data tabular structure. This data structure is where the bulk of your data analysis work takes place. You can perform even more complex operations on DataFrames, in addition to the ones you’ve done on the Series. Some of the more complicated operations include merging DataFrames using joins, summarizing DataFrames with aggregation functions, and grouping columns by data.
Now that you’ve learned the basics of the Series and DataFrame data structures, it’s time to dig a little deeper into the underlying mechanics of it, starting with datatypes. Strings, Dates, Times, and Categorical are common data types you’ll encounter on a daily basis. Thus, you’ll need to learn how to handle and work with them. You’ll also learn how to use the multiindex to organize hierarchical data and even transform DataFrames using techniques such as pivoting, stacking, and stacking to get data into the right shape.
How You’ll Learn
This course is ≈3 hours long, consisting of 23 lecture videos (≈2 hours) and 20 challenge videos (≈1 hour). You’ll learn by watching the lecture videos and taking down notes. Then, you’ll work on the Google Collab exercises given to help you put into practice what you’ve learned.
| Channel | GormAnalysis |
| Provider | YouTube |
| Instructor | Ben Gorman |
| Level | Beginners |
| Workload | 2–3 hours |
| Views | 11K |
| Certificate | None |
Fun Facts
- This course was developed with Pandas version 1.2.0
- There is also a written format of this course available on Practice Probs.
- This course is the successor to Python NumPy For Your Grandma.
If you’re interested in this course, you can find more information about the course and how to enroll here.
3. Pandas (Kaggle)
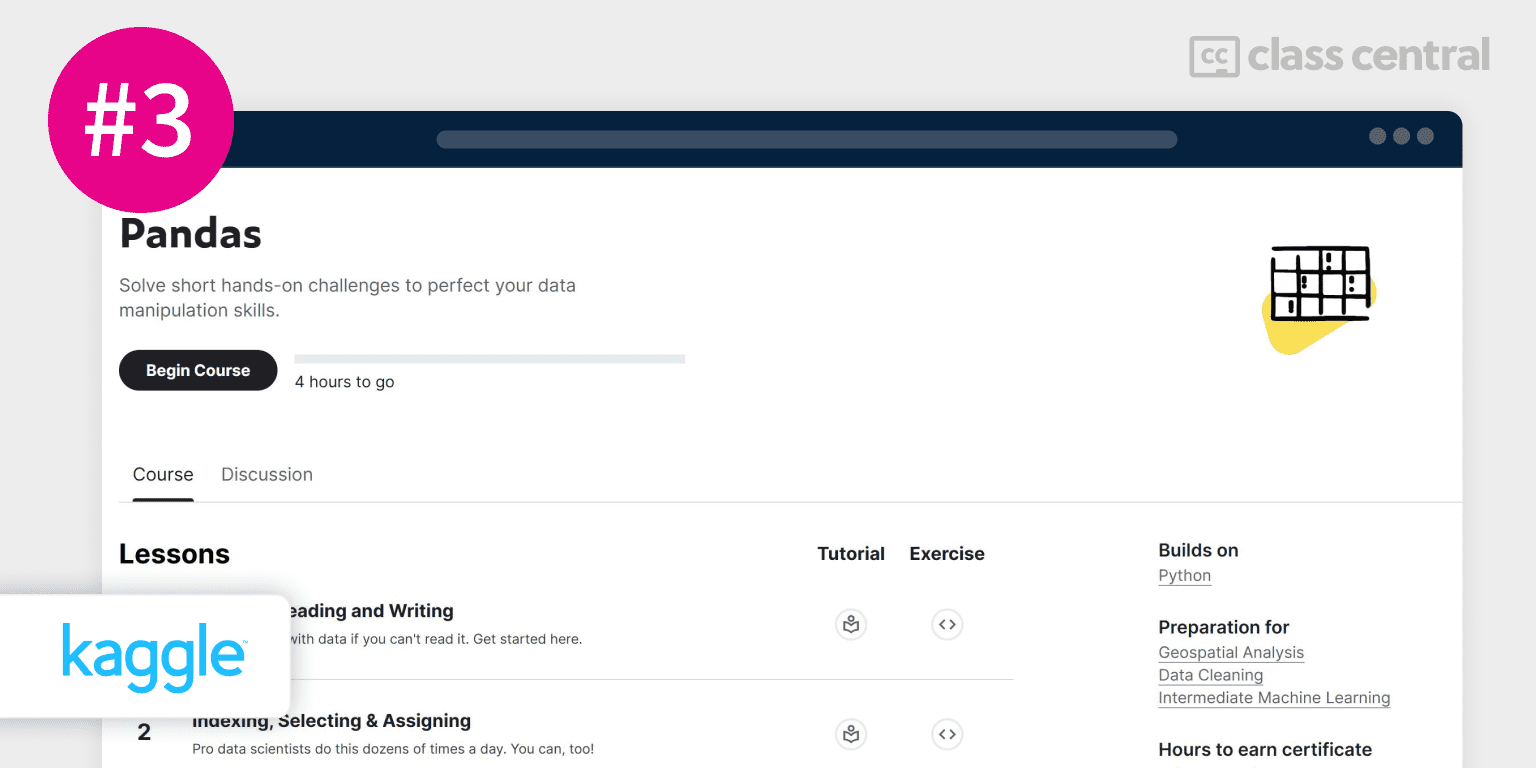
My third pick for the best pandas course is Kaggle’s pandas course.
Kaggle is an online platform for data science competitions and collaboration, and what better way to learn pandas than from a data science website?
In this free micro-course with free certificate, you’ll learn how to manipulate data and extract insights with pandas through Jupyter notebook tutorials and hands-on challenges. These exercises will have you struggle against the quirkiness of real-world data to develop your data-wrangling skills.
No experience with pandas is required to take this course.
What You’ll Learn
First off, you’ll start by creating your own DataFrames (tables) and Series (lists) to get data into a structured format, and even read external data like csv files into pandas.
Selecting specific values of a DataFrame or Series to work on is a common task in data science, so you’ll need to learn how to work with them. You’ll learn how to select data with either indexes or labels, and also modify the indexes the DataFrame already has.
Pandas has many built-in aggregate functions to help you extract insights from data, but you can even make your own. You’ll also come across many instances of messy data in the real-world, for example, columns which are of the wrong data type, and entries with missing or malformed data. Luckily, pandas can help you fix that.
Finally the last section of the course covers something quite interesting — how to change the names of columns and how to combine data from multiple DataFrame or Series. These tools will help you nicely tie up and package data into a readable, coherent structure.
How You’ll Learn
This course has 4 hours of material in total, consisting of tutorials and exercises. You’ll learn by reading through the tutorials and working on the Jupyter notebook exercises that come with each tutorial. You’ll earn a certificate of completion once you’ve finished all the tutorials and exercises that you can show off to employers!
There’s also an active discussion board for the course that learners can use to share and discuss ideas.
| Institution | Kaggle |
| Instructor | Aleksey Bilogur |
| Level | Beginners |
| Workload | 4 hours |
| Certificate | Free |
Fun Facts
- The course has 34 bookmarks on Class Central.
- Aleksey Bilogur is currently a Software Engineer at Reddit. In the past, he has worked at Kaggle, Spell, Quilt Data, NYU CUSP, and MODA.
If you’re interested in this course, you can find more information about the course and how to enroll here.
4. Data Manipulation with pandas (DataCamp)
DataCamp’s Data Manipulation with pandas course will partner you up with pandas and embark on a journey to wrangle some real-world datasets!
In this paid course with free trial, you’ll learn how to import and clean data, calculate statistics, and create visualizations with pandas through lecture videos and interactive quizzes and exercises. By the end of this course, you’ll be able to use DataFrames to effectively manipulate, analyze, and visualize all sorts of data.
You should have an intermediate level understanding of Python prior to taking this course.
What You’ll Learn
First and foremost, you’ll start by mastering the most important pandas data structure: DataFrames. You’ll learn how to inspect DataFrames and manipulate them by sorting, subsetting, and adding new columns. You’ll then dive into aggregating DataFrames, where you’ll calculate summary statistics on DataFrame columns, and discover the power of grouped summary statistics and pivot tables for more sophisticated data analysis.
The course continues with an exploration of slicing and indexing DataFrames, as sometimes you may only want to select and change some parts of your data. You’ll learn all the techniques needed to make this as easy and efficient as possible. Finally, you’ll learn how to create and visualize DataFrames, handling missing data values with ease, and importing data from and exporting data to CSV files.
How You’ll Learn
This course is 4 hours long, with 15 videos and 56 exercises in total. You’ll learn by watching the well-presented lecture videos, answering the MCQ quizzes, and completing the interactive coding exercises in DataCamp’s browser-based programming environment.
| Institution | DataCamp |
| Instructors | Maggie Matsui and Richie Cotton |
| Level | Intermediate |
| Workload | 4 hours |
| Enrollments | 272K |
| Rating | 4.4 / 5.0 (132) |
| Certificate | Paid |
Fun Facts
- Datacamp is an online learning platform that focuses on, as you guess it, all-things data. You can find data science, data analytics, machine learning, deep learning, and all sorts of topics on their website.
- If you have a valid university email and have signed up for the GitHub student pack, you can get a 3 months free trial from DataCamp.
- The collaborators for this course are: Amy Peterson, Adel Nehme, Alex Yarosh, and Justin Saddlemyer.
- This course is part of five DataCamp tracks: Data Analyst with Python Track, Data Manipulation with Python Track, Data Scientist with Python Track, Data Scientist Professional with Python Track, and Python Programmer Track.
If you’re interested in this course, you can find more information about the course and how to enroll here.
5. Advanced Pandas (LinkedIn Learning)
Perhaps you’re familiar with the basics of pandas, but would like to take your skills to the next level. In that case, Advanced Pandas by Brett Vanderlock is the best course for you!
This paid concise but jam-packed course with free trial will help you get the most out of your data. You’ll learn how to take advantage of some of the most advanced and critical functions pandas has to offer. From working with dates, to dealing with missing data, to transforming data frames, and to techniques for rapid exploratory data analysis, this course covers it all in its Jupyter Notebook exercises. Additionally, you’ll see what lies beyond pandas and see how Dask and Spark are used for geospatial and big data processing.
To take this course, you’ll need some basic experience with using pandas.
What You’ll Learn
The first part of the course briefly summarizes pandas fundamentals, including importing data into DataFrames, indexing and selecting data, and utilizing essential pandas functions like value_counts(). Did you know you can configure pandas? You’ll learn how to change settings such as the maximum number of columns that can be displayed.
After that recap, you’re now ready to tackle advanced pandas functions! Beginning with datatypes, you’ll discover how to convert columns from one datatype to another, work with Strings and DateTimes, and also handle missing data by dropping, filling, or interpolating them. Furthermore, you’ll learn how to apply functions in order to modify large amounts of data simultaneously.
Moving to a higher-level view of DataFrames, you’ll learn how to drastically change their structure with multiple functions, first with groupbys and aggregates, then reshaping them, and then finally merging and concatenating multiple DataFrame.
Pandas is widely-used enough to warrant its own data analysis and data visualization functions, and you’ll take advantage of them. For example, you’ll be able to find correlations between columns and even visualize DataFrames in various types of plots. Finally, the course concludes by explaining how you can use the pandas-profiling library to generate detailed EDA reports, use Geopandas for geographic data, and move beyond pandas with Dask and Spark.
How You’ll Learn
This course is 1 hour long. You’ll learn by watching the well-produced bite-sized videos and completing the Jupyter notebook exercises as you move through the course.
| Institution | Madecraft |
| Provider | LinkedIn Learning |
| Instructors | Brett Vanderblock |
| Level | Advanced |
| Workload | 1 hour |
| Enrollments | 23K |
| Rating | 4.7 / 5.0 (365) |
| Certificate | Paid |
Fun Facts
- Brett Vanderblock, Data Scientist at Patagonia and Pandas has been there every step of my journey to becoming a data scientist and producing insightful analytics.
- This course is part of the LinkedIn Learning’s Master Python for Data Science Learning Path. In it, you’ll learn essential skills a Data Scientist needs to have such as NumPy, pandas, and machine learning.
- Madecraft is an online learning platform that provides video courses on various topics such as technology, business, and creative skills.
If you’re interested in this course, you can find more information about the course and how to enroll here.
6. Analíticas de Datos con Pandas (Tecnológico de Monterrey)
If you speak Spanish, I have the perfect course for you from Tecnológico de Monterrey in Mexico!
Analíticas de Datos con Pandas will have you embark on an exciting journey through the world of data analytics with pandas. Through this free-to-audit course, you’ll learn the concepts, methods, and functions of pandas (and some matplotlib), allowing you to rapidly and easily analyze data by creating and manipulating DataFrames.
No prior experience with pandas is required to take this course.
What You’ll Learn
This course is structured into four sections:
In the first section, First Steps with Pandas, you’ll learn how to install and set up the pandas library, explore its fundamental elements, and delve into its history and popularity.
Next in Main Components in Pandas, you’ll focus on pandas’ data manipulation capabilities, particularly its way of handling data structures like Series and DataFrames. You’ll also learn essential pandas functions for data manipulation and analysis.
Want to know why pandas is often called Excel on steroids? Operations in Pandas will have you explore pandas basic and advanced operations for performing calculations on data structures, columns, rows, and string data, and see for yourself how true the euphemism is!
The final section of the course, Use Cases with Pandas, covers Exploratory Data Analysis (EDA), a critical component of data science projects, as defined by John W. Tukey. You’ll end the course by learning how to do exploratory data analysis with Pandas, before diving into data visualization techniques supported by additional libraries such as matplotlib that work in tandem with pandas.
How You’ll Learn
This course is 4 weeks long, with 25 hours worth of material. The course mainly consists of short videos that introduces you to the concepts you’ll learn in the following reading materials.
As for the exercises, they are made up of ungraded practice quizzes to evaluate your understanding of the material, discussion prompts for you to share your thoughts and read other people’s answers, graded quizzes that tests bite-sized knowledge of pandas, and finally peer-graded assignments that put you into the shoes of a data analyst where you’ll solve the problem using all the knowledge you’ve learned so far and be graded by other learners taking the course.
| Institution | Tecnológico de Monterrey |
| Provider | Coursera |
| Instructor | Jesus Aguilar Gonzalez |
| Level | Beginner |
| Workload | 25 hours |
| Certificate | Paid |
Fun Facts
- Jesus Aguilar Gonzalez is a professor in the field of Data Visualization at Tecnológico de Monterrey currently pursuing a Doctorate in Interface Design at the University of Barcelona. He is currently the Director of the Engineering programs in Business and Information Technologies and Digital Transformation Engineering.
If you’re interested in this course, you can find more information about the course and how to enroll here.
7. Solving Real-World Data Science Interview Questions! (with Python Pandas) (Keith Galli)

If you’re learning pandas in the hopes of pursuing a career in data science, then you’ll also need to prepare for the pesky interview questions a company might throw at you. This is where Keith Galli’s course, Solving Real-World Data Science Interview Questions!, comes in!
Keith spent many years interviewing and hiring candidates for data science positions, and he’ll teach you in this free course many of the things an interviewer looks for in a successful candidate. You’ll solve interview questions from easy to hard.
You should have some experience with pandas in order to take this course.
What You’ll Learn
This course is divided into two parts. The first part focuses on coding with pandas where you’ll solve classic interview questions, which are as follows:
- Find the current salary of each employee in a dataset with old and outdated information.
- Find the average number of bathrooms and bedrooms for each city’s property type in a dataset.
- Find the number of occurrences of the words ‘bull’ and ‘bear’ in a text.
- Calculate the customer revenue of a company’s dataset in March:
- Given a table of purchases by date, calculate the monthly percentage change in revenue.
- Find the total number of downloads for premium vs freemium in a dataset.
The second part does not involve any coding at all, unlike the first part, and will instead challenge your critical thinking and problem-solving abilities. You’ll come up with innovative, high-level solutions to different data science problems. The questions you’ll be asked in the course are:
- How can you find where a person lives based on their credit card activity?
- What methods can you use to detect outliers in a dataset?
- What is the probability that a girl has a sister from a probability distribution?
- Uber Black rides have dropped by 10%. How would you investigate this reduction?
- And finally, how would you approach the task of processing a Terabyte of data using a Python script?
How You’ll Learn
This course is 1–2 hours long, and split into two parts: a coding-focused section and a high-level question. You’ll learn by watching the code demos and following along with Keith as he codes or finds the solution to each problem.
| Channel | Keith Galli |
| Provider | YouTube |
| Instructor | Keith Galli |
| Level | Intermediate |
| Workload | 1–2 hours long |
| Views | 56K |
| Likes | 2K |
| Certificate | None |
Fun Facts
- Keith Galli posts a wide range of educational videos on topics such as coding, data science, and technology. His most popular tutorials are on data analysis, web development, and machine learning.
If you’re interested in this course, you can find more information about the course and how to enroll here.
8. Pandas Workshop (Stefanie Molin)
Looking to learn through hands-on experience with Jupyter notebooks and exercises as you go? If so, Stefanie Molin’s Pandas Workshop is the perfect fit for you! This course has been delivered at five different conferences and is completely free.
Throughout the workshop, you will develop the essential pandas skills needed to manipulate and analyze data. This includes filtering, aggregating, reshaping, and more. In addition, you’ll learn how to effectively visualize your data using popular plotting libraries like matplotlib and seaborn.
Before taking this course, it’s recommended that you have a basic understanding of Python and feel comfortable using Jupyter Notebooks.
What You’ll Learn
You’ll kick off this course by exploring the three fundamental building blocks of the pandas library: Series, DataFrame, and Index classes. You’ll learn how to work with these building blocks and be able to create and manipulate DataFrames to inspect and filter data.
Before diving into data analysis, we need to ensure our data is primed and ready — who knows if we have missing or wrong data. That’s where data wrangling comes in! You’ll delve into various methods for cleaning and formatting data. To this end, you’ll tackle tasks such as renaming columns, ironing out data type inconsistencies, and reshaping data. Moreover, you’ll look into enriching your data by discretizing columns, performing aggregations, and fusing data from different sources.
To gain a better understanding of data, we usually visualize it by plotting it. Luckily, pandas make it really easy to plot thousands of data points or attributes. With the help of the plotting libraries Matplotlib and Seaborn, you’ll learn how to plot data in a variety of ways: histograms, line plots, and more.
Finally, you’ll end the workshop with a lab session where you’ll analyze 2019 US flight data, where you’ll apply all the material you’ve learned so far.
How You’ll Learn
This course is made up of 4 sections, in Jupyter notebook form and slide form. You’ll learn by running the cells and experimenting with them. Each section contains exercises, which you should complete in the workbook.ipynb notebook. The solutions to the exercises as well as the lab are given in the course.
| Provider | GitHub |
| Author | Stefanie Molin |
| Level | Beginner |
| Workload | N/A |
| Forks | 442 |
| Stars | 220 |
| Certificate | None |
Fun Facts
- Stefanie Molin is a software engineer and data scientist at Bloomberg in New York City. She specializes in tackling complex issues in information security, with a focus on data wrangling/visualization, developing data-gathering tools, and promoting knowledge sharing.
- She is also the author of Hands-On Data Analysis with Pandas, a Python data science handbook for data collection, wrangling, analysis, and visualization.
- If you’re wondering, the conventions this workshop has been delivered in so far are ODSC Europe 2021, the 5th Annual Toronto Machine Learning Summit 2021, PyCon US 2022, PyCon UK 2022, and PyCon Portugal 2022.
If you’re interested in this course, you can find more information about the course and how to enroll here.
9. Joyful Pandas (Yuanhao Geng)
Joyful Pandas is probably the best free pandas tutorial written in Simplified Chinese.
This course covers all the core operations and features of pandas (and even some native Python concepts and some NumPy basics) you need to get started with data analysis! It is divided into three modules: basic knowledge, four types of operations, and four types of data.
The PDF version, notebook version, and datasets of this tutorial can be downloaded from the github. Meanwhile, you can find the online version of this tutorial here.
What You’ll Learn
The first module of this course serves as the primer for all things pandas. Here, you’ll recap some Python’s native capabilities like list comprehensions, anonymous functions, and zips. Then, you’ll study NumPy, the library pandas is built on, including its common array operations. With these two tools in hands, you’re now ready to dive into the basics of pandas without overwhelming yourself!
DataFrames are a wonderful data structure, and the essential operations for DataFrames are four: indexing, grouping, reshaping, and merging. In the second module, you’ll master the art of setting and selecting indexes, understand categorizing data with groups, transform tables of all sizes, and finally merge your way to victory by combining multiple DataFrames into one.
Real-life data is very messy. There are three types of data that appear very frequently in datasets: text data, categorical data, and time series data. You’ll learn how to manipulate string objects, detail the types of categorical data, and deal with the intricacies of datetimes in time series data. However, there’s also another beast you need to watch out for — missing data. Missing data in columns isn’t something we can use, so you’ll learn the various techniques to deal with them, like summarization, deletion, filling, and interpolation.
How You’ll Learn
This course is made up of 10 chapters, with about 80 practice questions and around 20 exercises in total. At the end of chapter, there are relevant exercise problems to help readers consolidate their knowledge, which you can find their answers to in the appendix.
| Institution | Datawhale |
| Instructor | Yuanhao Geng |
| Level | Beginner |
| Workload | N/A |
| Certificate | None |
Fun Facts
- Yuanhao Geng is a member of Datawhale and an active contributor to the pandas ecosystem (including bug fixing, feature implementation, and performance optimization). He has a master’s degree in statistics from the University of Wisconsin-Madison.
- He’s also the author of the printed version of this tutorial (written in Chinese) called pandas数据处理与分析. It uses a newer version of pandas (1.4.0) and adds three additional chapters on data visualization, feature engineering, and performance optimization.
- This course has also been selected by the official pandas team as a recommended community tutorial.
If you’re interested in this course, you can find more information about the course and how to enroll here.
10. Pandas cookbook (Julia Evans)
The 80:20 rule also applies to pandas: 80% of the results comes from 20% of the effort.
So what 20% of pandas do you need to learn in order to get 80% of the results?
The common code patterns and programming recipes used in pandas of course!
In Julia Evan’s free open source course, Pandas cookbook, you’ll quickly get started with pandas. How? This short yet info-packed course cleans, explores, and analyzes three real-world datasets in Jupyter notebooks, putting you in the shoes of a data scientist. You’ll learn how to tackle the common problems real-world datasets normally arrive with
What You’ll Learn
This course is made up of 9 chapters, whose topics are as follows:
- Introduction to Jupyter Notebook, including tab completion and magic functions.
- Reading data from a CSV file into pandas.
- Selecting and manipulating data in pandas dataframes, including filtering and slicing.
- Using groupby and aggregate functions to analyze data.
- Combining dataframes and web scraping with pandas.
- Working with strings in pandas dataframes, including vectorized string operations
- Cleaning up messy data using pandas.
- Parsing Unix timestamps.
- Loading data from SQL databases (SQLite3, PostgreSQL, and MySQL) into pandas with examples.
How You’ll Learn
This course consists of 9 chapters. You’ll learn by reading through the course chapters and taking note of the tips and problems presented in the course. You’ll also be able to run and test the code in the Jupyter Notebook.
| Provider | GitHub |
| Instructor | Julia Evans |
| Level | Beginner |
| Workload | N/A |
| Forks (Enrollments) | 2.1K |
| Stars | 6.1K |
| Certificate | None |
Fun Facts
- Julia Evans is a software developer at her own programming zines business, wizard zines.
- You can run this course by git-cloning it to your PC, or if you’re lazy (like me), you can run it online.
- This repo has also been translated to Chinese.
If you’re interested in this course, you can find more information about the course and how to enroll here.