How to Choose a Coding Bootcamp Using Outcomes Data
Bootcamps aren’t always transparent about their outcomes data. We gathered the reliable outcomes reports into two easily comparable tables.

Providing students with reliable outcomes data has been a white whale of the bootcamp industry. The importance of outcomes data is understandable: students take risks whenever they attend any school, and students deserve to know how likely they are to succeed and get a job. In the case of bootcamps, the average tuition is $11,900 (significantly higher than tuition at a community college in the US), and given how new bootcamps are they don’t have the credibility of established colleges or universities.
The problem of outcomes data is complicated by the many cases of bootcamps manipulating their data to make their outcomes look better than they actually are. For example, Holberton School used to claim on their website that 100% of their graduates found software engineering jobs, which may technically be true depending on how “graduate” is defined but which does not reflect the experience of most Holberton students. This post will explain in detail how Holberton was able to achieve a 100% figure, but for now it’s sufficient to note that not all numbers published by bootcamps are trustworthy.
Class Central recommends only relying on data that is either (a) released by a government agency, or (b) released and audited by a third party such as CIRR. In general, it’s a good idea to avoid data that is only available on a bootcamp’s website and that has not been verified in some way by a third party. This post will break down how to interpret two sources of bootcamp outcomes data: CIRR and BPPE. CIRR represents a group of bootcamps who came together to come up with a standard way of reporting outcomes data, and BPPE represents the California government agency charged with regulating for-profit education in California.
How to choose a bootcamp absent outcomes data
Bootcamps tend to release reliable outcomes data for two reasons: their outcomes are extremely good, or they’re legally mandated to do so. Gathering reliable outcomes data takes a lot of effort—surveying alumni is not quick or easy—and the only way schools will be incentivized to do it properly is if they’re required to by law or if their data is good enough to serve as a marketing tool. This means that for most bootcamps, prospective students won’t be able to use outcomes data to make their decision.
At Class Central, our first recommendation for anyone considering whether to attend a bootcamp is to try freely available resources first. FreeCodeCamp offers a free Javascript curriculum, and Class Central’s website is a great way to find freely available programming MOOCs. (Editor’s note: Class Central may earn an advertising commission if you sign up for a MOOC through Class Central’s website). While free resources might not work for everyone, it is possible to learn to program using free resources, and trying free resources first is a great way to figure out if you’re actually committed to programming before spending a lot of money on a bootcamp.
For students who have tried free resources and are still set on attending a bootcamp, it’s still possible to get a sense of the outcomes of different bootcamps by going on LinkedIn, searching for alumni, and talking to them about their experiences. LinkedIn’s search tool can sometimes display more successful alumni first and less successful alumni later, so make sure to scroll through all of the results to get the full picture on the range of different outcomes. It’s a good idea to reach out to a few alumni and ask them some questions about their time at the bootcamp; this is a way to make sure that the linkedin profiles are real and also a way to get information about other aspects of the bootcamp. By going through LinkedIn, prospective students are essentially replicating the same process that bootcamps use to gather their outcomes data: conducting a survey of graduates to figure out what percentage of graduates get jobs.
While outcomes data is a tool to help make the decision about what bootcamp to attend, it shouldn’t be the only tool. Other factors such as curriculum, instructors, and graduation rates are also important. There are guides available that go into more detail about this, such as FreeCodeCamp’s guide. That said, a lot of the bootcamp “review” sites that provide guides or so-called objective information are not objective at all; they get paid by the bootcamps themselves to write positive things about them. Beware of reviews from students, these reviews tend to skew towards positive experiences. In general, it’s a good idea to verify any claims yourself, either by going through LinkedIn data or by discussing the choice to attend a bootcamp with people you trust.
(Editor’s note: as of publication Class Central does not have any financial relationships with the bootcamps listed in this article.)
How to Interpret CIRR Data:
CIRR data is available online, and the unfortunate thing about CIRR data is that not all of its data is held to the same standard. There are some bootcamps that submit data every half year, and more importantly, have that data audited by an independent auditor. There are other bootcamps, such as Lambda School, that only submit data once and never return to submit new data or audit the data. (Lambda School was just accused of fraudulently inflating its outcomes data, so its CIRR data should be treated with suspicion). The reliable data on CIRR will be (1) audited by an auditor, and (2) released for multiple reporting periods. Audited data will be labeled as “audited” on the CIRR website.
An example of audited CIRR data is Tech Elevator’s Cincinnati Campus’ H1 2018 data. This data, like all CIRR data, is available as a PDF on the CIRR website. The PDF document from CIRR has two components: a letter from an auditor explaining that the data was audited, and a table containing the actual data. A screenshot of the table is displayed below.
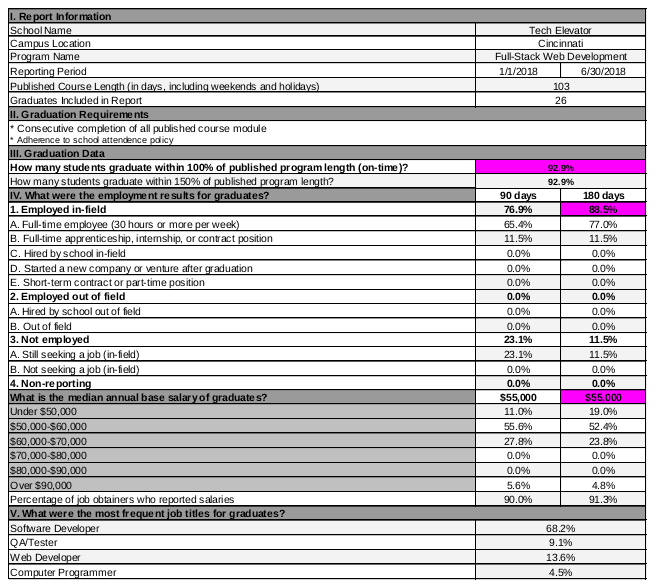
There are a few numbers worth highlighting. The most important number is the on-time graduation rate, which in Tech Elevator Cincinnati’s case is 92.9%. The second number is the in-field placement rate—the percentage of graduates who get jobs in the field they studied—which in this case is 88.5%. The in-field placement rate is further broken down into categories of jobs, including whether the job is an internship (11.5%) or whether the job is a staff position (77%). The placement rate is the placement rate for Tech Elevator graduates, not for all Tech Elevator students, so the placement rate is not the same thing as the probability that someone who enrolled in Tech Elevator will get a job. One way to estimate the likelihood enrolled students have of finding jobs is to multiply the graduation rate by the placement rate, which for Tech Elevator Cincinnati gives an approximately 82.2% chance of graduating on time and getting a job.
Because CIRR data is displayed in PDFs, it can be difficult to compare data from different bootcamps to see which schools have the better outcomes. Class Central has displayed all of the audited data from 2017 onwards in a table below. (CIRR has 2016 data, but a significant portion of the bootcamps that submitted audited data for 2016 didn’t submit audited data for subsequent years, suggesting that the data might be out of date or otherwise unrepresentative).
| School | Location/Program | Year | H1/H2 | Ontime Graduation Rate | Withdrawal Rate During Reporting Period | Graduate In-field Placement after 180 days | Graduate In-field full time employee (i.e. no internships, no contract work) placement rate after 180 days |
| Bloc | Designer | 2018 | 2 | #N/A | 67.0% | 96.3% | 59.3% |
| Bloc | Web Developer | 2018 | 2 | #N/A | 83.3% | 80.9% | 66.0% |
| Launch Academy | Boston | 2018 | 2 | 52.6% | 83.3% | 56.7% | |
| Tech Elevator | Cincinnati | 2018 | 2 | 89.8% | 93.2% | 63.6% | |
| Tech Elevator | Cleveland | 2018 | 2 | 94.4% | 88.1% | 82.1% | |
| Tech Elevator | Columbus | 2018 | 2 | 99.0% | 97.9% | 88.4% | |
| Tech Elevator | Pittsburgh | 2018 | 2 | 95.2% | 95.0% | 90.0% | |
| Thinkful | Online Data Science Flex | 2018 | 2 | #N/A | 53.4% | 73.3% | 57.8% |
| Thinkful | Online Engineering Flex | 2018 | 2 | #N/A | 59.0% | 77.0% | 57.0% |
| Thinkful | Online Engineering Immersion | 2018 | 2 | 75.6% | 81.1% | 52.7% | |
| Bloc | Designer | 2018 | 1 | #N/A | 26.3% | 92.9% | 50.0% |
| Bloc | Web Developer | 2018 | 1 | #N/A | 48.1% | 71.7% | 54.7% |
| Launch Academy | Boston | 2018 | 1 | 60.7% | 91.7% | 75.0% | |
| Tech Elevator | Cincinnati | 2018 | 1 | 92.9% | 88.5% | 77.0% | |
| Tech Elevator | Cleveland | 2018 | 1 | 94.4% | 91.2% | 82.4% | |
| Tech Elevator | Columbus | 2018 | 1 | 94.4% | 97.1% | 82.4% | |
| Thinkful | Online Engineering Immersion | 2018 | 1 | 81.6% | 89.5% | 55.3% | |
| Thinkful | Online Data Science | 2018 | 1 | #N/A | 51.3% | 87.5% | 75.0% |
| Thinkful | Online Full Stack Flex | 2018 | 1 | #N/A | 48.5% | 83.5% | 60.4% |
| Launch Academy | Boston | 2017 | 2 | 43.3% | 92.9% | 69.0% | |
| Tech Elevator | Cleveland | 2017 | 2 | 92.1% | 88.3% | 78.3% | |
| Tech Elevator | Columbus | 2017 | 2 | 92.6% | 90.5% | 79.4% | |
| The Software Guild | Louisville | 2017 | 2 | 61.8% | 92.0% | 68.0% | |
| The Software Guild | Minneapolis | 2017 | 2 | 51.5% | 83.3% | 72.2% | |
| Turing School | Back-End Engineering | 2017 | 2 | 69.6% | 76.6% | 68.1% | |
| Turing School | Front-End Engineering | 2017 | 2 | 67.3% | 87.8% | 75.6% | |
| Launch Academy | Boston | 2017 | 1 | 57.7% | 82.1% | 53.6% | |
| Tech Elevator | Cleveland | 2017 | 1 | 90.6% | 93.1% | 93.1% | |
| Tech Elevator | Columbus | 2017 | 1 | 92.9% | 92.3% | 92.0% | |
| The Software Guild | Akron | 2017 | 1 | 85.2% | 87.0% | 69.6% | |
| The Software Guild | Louisville | 2017 | 1 | 100.0% | 88.9% | 66.7% | |
| The Software Guild | Minneapolis | 2017 | 1 | 77.3% | 94.1% | 88.2% | |
| Turing School | Back-End Engineering | 2017 | 1 | 64.2% | 75.8% | 65.2% | |
| Turing School | Front-End Engineering | 2017 | 1 | 66.7% | 77.6% | 63.3% |
(Note: some programs, like Bloc and Thinkful, are self paced and do not have a fixed course length, meaning its not possible to report an on-time graduation rate that is equivalent to the graduation rate of other programs.)
How to Interpret BPPE Data:
California law requires that every for-profit school seek approval from BPPE to operate. (Some bootcamps, such as Lambda School, operate illegally without BPPE approval.) One condition of being approved by BPPE is that schools must submit outcomes data to BPPE, who then publish the data on their website. Generally, it’s reasonable to assume that data reported by BPPE is accurate because lying to BPPE has the potential to be catastrophic, given that the agency has the ability to shut any for-profit school down.
To make it easy to compare data from different bootcamps, Class Central has taken the 2017 BPPE data from several bootcamps and placed it in the table below. A nice feature of BPPE data is it reports the total number of students at each step in the pipeline, which allows anyone to calculate the percentages themselves. BPPE allows schools to declare students to be ineligible to be counted in graduation and placement stats. There are legitimate reasons for doing this; to use a morbid hypothetical example, if a student dies in the middle of a program it isn’t possible for them to graduate regardless of what a school does. However, the way that BPPE defines eligibility may be different from how CIRR defines eligibility, which is why BPPE and CIRR numbers are not directly comparable.
| School | Program | Year | # Enrolled | # Eligible for Graduation | # On Time Graduates | # Graduates Eligible for Employment | # Employed In Field, 30+ Hours Per Week | Graduation Rate | Placement Rate of Graduates |
|---|---|---|---|---|---|---|---|---|---|
| App Academy | Full-Time Software Engineering Program | 2017 | 391 | 391 | 328 | 328 | 210 | 83.89% | 64.02% |
| Galvanize | Data Science Immersive | 2017 | 138 | 138 | 118 | 102 | 88 | 85.51% | 86.27% |
| Galvanize | Web Development Immersive | 2017 | 61 | 61 | 48 | 46 | 37 | 78.69% | 80.43% |
| General Assembly | User Experience Design Immersive | 2017 | 291 | 291 | 269 | 257 | 192 | 92.44% | 74.71% |
| General Assembly | Web Development Immersive | 2017 | 310 | 310 | 249 | 241 | 165 | 80.32% | 68.46% |
| Hackbright Academy | Software Engineering (Full-Time) | 2017 | 165 | 154 | 154 | 154 | 43 | 100.00% | 27.92% |
| Hack Reactor | Full Stack Web Development Immersive | 2017 | 731 | 731 | 583 | 700 | 356 | 79.75% | 50.86% |
| Hack Reactor | Hack Reactor Remote (100% Online – In Real Time) | 2017 | 169 | 169 | 143 | 131 | 106 | 84.62% | 80.92% |
Common Tactics for Manipulating Outcomes Reports
Not all bootcamps are honest about their outcomes data, and Holberton School is a good example of this. For context, the BPPE recently accused Holberton of being an “immediate danger to the public’s health, safety, and welfare” and ordered Holberton to cease instruction at its San Francisco campus. At one point, Holberton advertised a 100% placement rate on its website, although Holberton recently removed that claim from its website, likely due to increased scrutiny.
The trick in Holberton’s 100% figure lies in its definition of “graduate”. According to the BPPE complaint against Holberton, Holberton offered two pathways to graduation. The first pathway was straightforward: if a student made it through the advertised two year program, they were considered a graduate. The second pathway was that students who dropped out after the first year could also be considered graduates if they found a job and did a work study program. This means Holberton graduates are a biased sample, because students who dropped out and didn’t get jobs weren’t counted, while students who dropped out and got jobs were. The definition of graduate was such that students with jobs were more likely to be counted than students without.
There are many tactics schools can use to manipulate their data, and it would be impossible to list them all. Here’s an incomplete list:
- Release data from a specific time period when the data is unusually good, and not release data for any other time periods.
- Release data for an extremely small sample size (e.g. one student!).
- Kick out low performing students, which lowers the graduation rate but increases the placement rate (high performing students are more likely to get jobs), and report the (increased) placement rate but not the (lowered) graduation rate.
Because of all the different ways of manipulating data, it’s not a good idea to rely on data that hasn’t been submitted to a third party organization (i.e. data only available on a bootcamp’s website). There are too many ways to manipulate definitions and let the data look better than it actually is. There’s also the risk that if bootcamps report data using their definitions, it becomes impossible to compare the data with data from competitors. In general, in cases where data isn’t submitted to a third party, it’s a better idea to rely on other methods of evaluating the quality of a bootcamp.
Tags


