Exploring Course Structure at HarvardX: A New Year’s Resolution for MOOC Research
One of the minds behind HarvardX / edX explains in detail how they structure their courses, and how they gather and then use data to improve course structures.
This post originally ran on Harvard University’s Office of the Vice Provost for Advances in Learning blog and on the edX blog. It can be found here and here.
Course structure – the type, frequency, and grading of various activities in a course – has been shown to be a tunable parameter with which to affect learner behavior and outcomes (Freeman). On-campus, transitions from traditional lecture to active learning formats benefit student behavior, learning outcomes, and attitudes (Laverty, Deslauriers). For example, Laverty et. al changed exam structure from two midterms and a final to bi-weekly exams. Their findings show increased performance, a reduction in guessing and cheating, and improved attitudes (instructors expected students to revolt). There are many other examples that highlight how the structure of on-campus courses impacts student outcomes, and it is natural to assume that course structure can be optimized in distance and open-online settings.
At HarvardX, roughly 120 courses (including reruns) have been launched with no single prescription for course design. This choice was deliberate, as it allowed HarvardX to fully explore the ever improving edX platform while not constraining courses into structures ill-suited for their subject. But as the size of the HarvardX course catalog grows and continues to diversify, there is a need to design research tools that study course design in service of understanding learning outcomes. Inspiration from the learning sciences is broadly summarized in a quote from Herbert Simon’s “The Sciences of the Artificial”:
“Human beings, viewed as behaving systems, are quite simple. The apparent complexity of our behavior over time is largely a reflection of the complexity of the environment in which we find ourselves.”
In 2016, my hope is to revitalize discussions around course design and structure through three initial lines of exploratory research:
- categorization of all HarvardX content in service of understanding course structure,
- building course structure visualizations that help illuminate design patterns for course designers and researchers, and
- employing predictive models that fuel more nuanced studies of course structure and associated learner outcomes (we will address this theme in a future post).
Although not explicit, each line of research sets the stage for exploring learning outcomes. But leaning on Simon, understanding the environment which we design for learners may provide a great deal of insight into outcomes. Below are early efforts in the New Year.
Three years of HarvardX courses
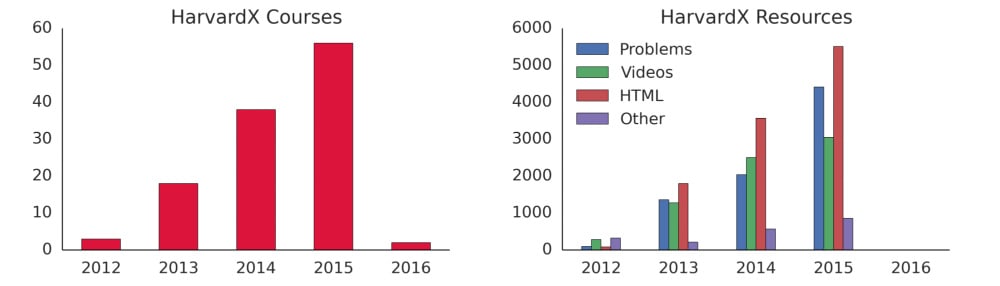
From 2012 to early 2016, HarvardX has launched roughly 120 courses, 8000 problems, 7000 videos, 11,000 HTML pages, and 2000 custom activities which typically employ advanced educational technology – e.g., the edX annotation tool. No single course design prescription has been established for HarvardX courses, nor any edX course for that matter. All 120 courses cut across a number of disciplines, from STEM to Humanities. The HarvardX ecosystem is truly diverse, and will continue to grow and diversify in the coming year. The figure below provides yearly stats on HarvardX content production.
Although this post takes a very high level approach in categorizing content, our ability to parse out nuanced features from HarvardX content goes far beyond simple counts. For example, we currently collect whether problems contain written feedback to learners, total length of individual videos, and the various components within an HTML page (contains images, iframes, etc). There are opportunities to add any number of content specific metrics that better explain features of the content or pedagogical context.
Of course we are also able to collect learner interaction metrics like clicks or attempts on problems, video player interactions, and interactions with HTML pages. As stated previously, connecting learner data to our categorization of HarvardX content is a major goal, but we first want a foundation upon which to stack those contextual data.
Visualizing Course Structure
Each HarvardX course contains a substructure made up of fundamental components organized into containers. For the purposes of this article, a component is a video, HTML page, or a problem, and a container is either a sequential or chapter (both are just linear sequences containing the aforementioned components, but chapters can contain sequentials). HarvardX recently mapped out and visualized course components manually to promote internal discussions around course design. We are currently automating the process of visualizing course structure in similar ways.
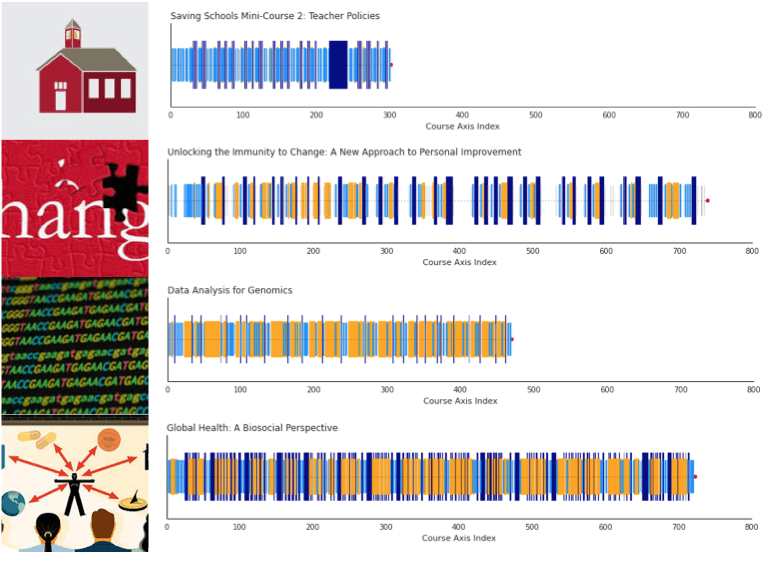
In the interactive figure below, the linear substructure of ChinaX – Part 1 is exposed as geometric shapes and colors: orange circles are videos, Dodger blue triangles are HTML pages, and the navy diamonds are problems. The x-axis represents the chronological order of resources in the course, and each resource is indexed as an integer value. You can even interact with these objects to expose metadata for each resource using your mouse (or your finger, if you’re on a tablet). Zoom in for more detail about resources by clicking and dragging over the desired range.
Our immediate hope is that visualizing structure will promote understanding of course design. For course teams wanting to maintain strict structure across all chapters of their course, visual inspection would help reveal deviations. For course designers aiming to refresh a course rerun, visuals might help show which chapters are thin on material. HarvardX has also made efforts to split some of its larger MOOCs into modularized courses, for example, Data analysis for Genomics was split into a series of modular courses. An open question for us is whether visualization can play a role in such modularization.
For research, an alternative visualization involves the same colors, but vertical lines of different length to distinguish resource type. Here we display course visualizations for four courses: Saving Schools #2 (a mini course), Unlocking Immunity to Change, Data Analysis for Genomics, and Tangible Things. For cross-course research, these bar codes allow one to quickly compare general structural features — an important distinction when trying to visually compare a large number of courses. A course team with the purpose of investigating individual elements of a course may prefer the geometric visualization.
Conclusions
In related project areas, researchers have recently applied pedagogical inventories to MOOCs, where a pedagogical inventory involves human classification on a number of scales addressing pedagogical design principles. Swan et. al have compared the pedagogical structure of 17 MOOCs using an inventory called AMP (Assessing MOOC Pedagogies), and Margaryan et. al have applied a similar inventory across 78 MOOCs. The goals of these papers were to try and understand how MOOCs fit into what is known about distance-education research. One finding from Swan’s work was that many MOOCs are replicating traditional college teaching online (a result that can also be gleaned from Margaryan’s work). Hence, is it plausible that we would see similar gains by adapting active learning strategies in an online setting?
Many MOOC researchers are now at a point where course catalogs are large enough to pursue comparisons of outcomes and activity based on course design. Our process has started at a ground level of simply cataloging content, and preparing ourselves to search for optimal patterns in course design. To end on a quote from the Swan et. al reference:
“The rapid growth of MOOCs has presented a pedagogical and design challenge that needs to be addressed as these courses continue to be developed at an expanding rate. The need to identify course designs that address student needs and increase student retention without overwhelming instructors is important.”
Here is to productive discussions on course design in 2016!


