Reviewing Michigan’s Statistics with Python Specialization
It took me about 180 hours to complete. It’s a lot of work, but the learning pay-off is considerable.
These days, concepts in statistics can be applied in numerous jobs. Researchers may need to plan how to gather data from a sample representative of their population of interest. Traditional and digital marketers can design and run experiments using Statistics to understand the business impact from introducing new products and services, or from improving an existing product by making adjustments or introducing new features. Then in the field of Machine Learning, businesses may apply concepts from Bayesian Statistics to Collaborative Filtering models to learn what motivates users or potential customers, in order to provide relevant recommendations and improve sales or user engagement.
Why I Took This Specialization
You may have learned some basic concepts about Statistics in school in the past and hardly ever used those concepts in your life again — I certainly did. For me, I previously learned concepts around the measures of central tendency and dispersion, probability distributions, sampling, hypothesis testing, drew and visualized data and distributions on paper, and derived proofs under Econometrics. I largely remembered only the measures of central tendency and dispersion, and returned the other concepts back to the instructors.
Yet in December, I needed to refresh and deepen my understanding of concepts in Statistics to prepare myself before moving into a Data Science role. I decided to check out this Statistics with Python specialization offered by the University of Michigan.
I went into the Statistics specialization confident that I could learn useful Statistics concepts in an accessible manner (and not be intimidated by scary looking mathematical notation and proofs) after taking the engaging Python for Everybody specialization offered by the University of Michigan.
I wanted to learn Statistics concepts applicable to Data Science such as sampling design, hypothesis testing when we have single or multiple explanatory variables, and visualize data and distributions from a dataset on a computer. This specialization also stood out for me as it covers quite a good range of statistical concepts using Python. Because when it comes to statistics, you may find it easier to find resources to learn how to work on Statistics problems using Python’s cousin, R.
What Does This Specialization Cover
The Statistics with Python specialization covers the following topics in three courses:
- Introduction to types of variables and their data type in Python
- Examples of statistical measures
- Introduction to Jupyter notebooks and Python libraries used in Statistics
- Visualize your dataset
- Univariate and multivariate data
- Probability and non-probability sampling design
- Confidence interval and hypothesis testing
- Linear and logistic regression models
- Multi-level and marginal models
- Bayesian approach to Statistics
The topics are covered via lecture videos teaching you the concepts, readings, hands-on Jupyter notebook exercises with code in Python, exercise walkthroughs, two graded written assignments and weekly graded quizzes (which require you to analyse the sample dataset to derive answers).
Instructors
This course is taught by a series of Professors and former Teaching Assistants from the University of Michigan Department of Statistics. Their biographies can be found on the “meet the course team” page. Their expertise in Statistics can be shown by how the instructors were able to present the course concepts that weren’t always simple in an engaging and accessible manner.
At times, the course features interviews with guests such as Ambuj Tewari (who looks at topics blending both Statistics and Computer Science at the University of Michigan), Daniel Almirall (who studies sequences of interventions in healthcare and education) and Tim Van Der Zee (who looks at Statistics in the context of education).

Course Highlights
The Jupyter notebook exercises started out by helping me recall how to code in Python, work with dataframes and some of the statistics functions we would use in the course. This was especially useful as I coded in a different programming language and syntax at work.
If you do not have experience coding in Python, I recommend you familiarise yourself with some basics of Python programming: data types, variables, arithmetic and dataframes. For the remaining libraries and functions you will use during the course, you may need to look up the official documentation from Numpy (for dataframes), Scipy (for statistics), Matplotlib and Seaborn (for visualizations), in addition to StackExchange.
I certainly spent a lot of time understanding how the relevant functions worked, their inputs and their outputs. I also spent more time on the “More Practice Exercises” each week where you have to solve problems with minimal guidance.

As the weeks progressed, I was gradually introduced to more challenging exercises, especially around the area of confidence intervals, hypothesis testing, multi-level and marginal models.
Confidence intervals and hypothesis tests in particular, involve different ways to calculate your statistical parameters (e.g. mean, standard deviation) for different types of tests. Therefore after completing the second course in the specialization — Inferential Statistical Analysis with Python — I revisited the concepts for a full view of how the calculations differ for different types of tests.
A huge factor which contributed to my positive experience during the Statistics with Python specialization was the discussion forums. A huge shout out to Brian who is part of the teaching staff and actively monitored the discussion forums. I was pleasantly surprised when Brian responded to questions within a day or two when I needed help to understand the course content or when debugging my code. Brian identified what I needed help with very well and responded with helpful, insightful posts to clear my conceptual roadblocks.
Time Commitment
I committed approximately 180 hours in total, with an average of 30 hours per week over 6 weeks, to complete this specialization.
If you are very familiar with functions available from numpy, pandas, matplotlib, scipy and working with dataframes, you could potentially reduce the number of hours you need to complete this specialization. Otherwise, you will probably spend time like me trawling through official documentation and StackExchange to figure out how certain functions work, especially in the weekly “More Practice Exercises”.
Another reason why I spent more time was because I replayed and tried to digest multiple times certain parts of the lecture when sentences are long, and I needed to interpret parts of a concept before interpreting a concept as a whole.
Personal Takeaways
To summarize, here are my takeaways from the specialization:
- Accessible coverage of statistical concepts using Python
- Helpful and responsive Teaching Staff on the discussion forums
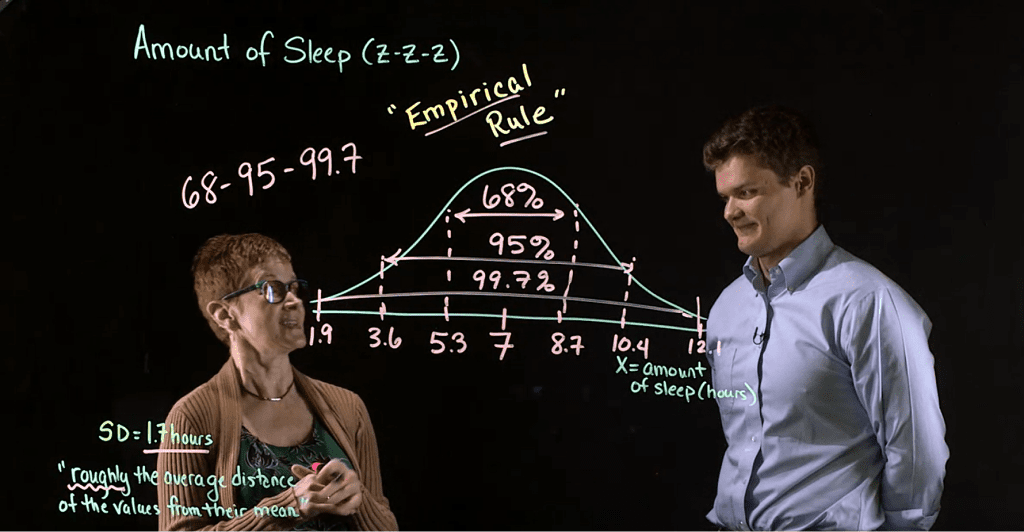
- Learn statistical concepts with intuitive visualizations (e.g. visualizing and interpreting a 95% confidence interval)
- Learn from instructor’s tips and pitfalls to look out for during sampling design
- Requires significant personal commitment and motivation


Steve
I have my Masters in Economics and could have used this class before my program. I studied business in school, and the statistics you learn is not as extensive as most classes in Math departments. I have taken classes in the Python specialization and those were excellent and have been curious about this one. Your recommendation has prompted me to sign up for the free trial. Looking forward to your next review and thanks for the information.
Tyler Hillery
Thanks for the helpful write up Kaiquan! I have been eyeing this course up as I need a statistics refresher before I began my master’s program.