15 Best R Courses for 2024: Uncover Insights, Drive Decisions
Learn the second-most popular language for data science after Python, favored by statisticians and researchers.
If you have some data and need to do statistical analysis, machine learning, or scientific research, you need R.
R is a programming language made by statisticians for statisticians. It’s easy to learn, being geared towards people with little to no programming background, and thus sees great use in industries such as the public sector, academia, healthcare, pharmaceutical, and insurance. R also has a tight-knit and vibrant community of researchers and professionals.
In this Best Courses Guide (BCG), I’ve scoured through the web to find the best courses to learn R. From introductory R programming and the tidyverse, to more specialized R courses for data science, statistics visualizations, and even fields like economics and business analytics, there’s bound to be the right course for you. The courses are all compatible with the latest major version of R 4.0.
And since most R users follow the spirit of open science, the overwhelming majority of the resources here are free or free-to-audit. I’ve also included books as R programmers absolutely love their reproducible reports and documents. It’d be a huge mistake not to include these amazing resources in this guide just because they require reading.
Click on the shortcuts for more details:
Here are my top picks. Click on one to skip to the course details:
What is R?
R is a programming language for statistical computing and graphics, created with statistics in mind. Hence, it is the second-most popular programming language for data science (behind Python) among data analysts, data scientists, statisticians, and the like, especially in finance and academia.
What makes R so popular is its versatility. R has a convenient library of specialized ready-to-use tools in the form of packages ranging from preprocessing, analysis, and visualization to machine learning, anything under the sun that has to do with data really, thanks to its vibrant open-source community.
Apart from that, R comes with an integrated development environment (IDE) called RStudio that has a ton of unique and specific features for doing data analysis. It is much less of a hassle to do exploratory data analysis and data visualization this way. Also, similar to Jupyter notebooks, R has its own flavor of notebooks in the form of RMarkdown.
R programmers can expect an annual salary of $75K, according to the StackOverflow 2023 Survey.
Courses Overview
- All of the courses are free or free-to-audit except for one.
- There are 6 courses, with the rest being books.
- Most of the courses are suitable for complete beginners to programming.
- All of the courses use R 4.0 or above unless stated otherwise.
Best Free Introductory Course for R and RStudio (Harvard)
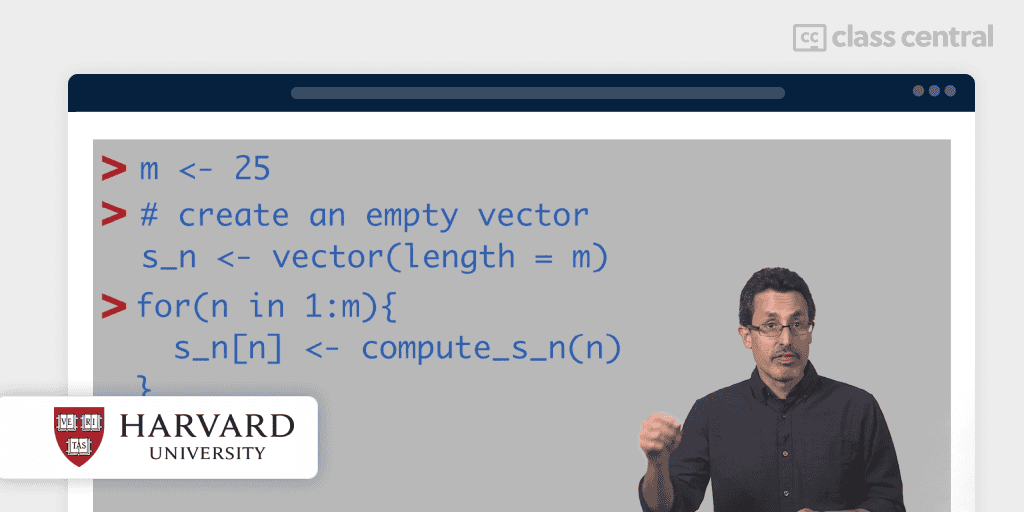
If you’re learning R, you are most probably learning it to deal with data. Fortunately, Harvard University’s Data Science: R Basics will teach you the basics of analyzing, visualizing, and working with data using R.
Taught by Rafael Irizarry, this free-to-audit course assumes no prior knowledge except for basic math and algebra. Here’s what I like about the course:
- Course Pedagogy:
- It’s engaging and practical. It uses bite-sized videos to teach you programming and data analysis techniques gently. Then, you’ll see these concepts in action when you analyze a real-world crime dataset using the R concepts you’ve learned, answering questions like ‘What is the smallest state?’ and ‘What is the average murder rate in the entirety of the US?’.
- Exercises & Quizzes:
- If you’re auditing this course, good news: 11 out of 13 quizzes are available to take. But that’s not the best part about this course. You’ll also gain hands-on programming experience writing R code with DataCamp’s interactive exercises. They are really handy especially for a first-time programmer!
- Discussion Forum:
- Thanks to the course’s size, the discussion forum is pretty active. If you need help, a fellow learner or a staffer will be there to help.
As for what you’ll learn, the course is 8 weeks long and split into four modules, in which you’ll learn:
- R Basics, Functions, Data types: You’ll get started with R, learn about its functions and data types
- Vectors, Sorting: Given a vector (a.k.a list) of cities or numbers, you’ll learn how to operate on them by using advanced functions like sorting or summing
- Indexing, Data Manipulation, Plots: Real-world data is messy, with missing values or abnormal data points. You’ll ‘wrangle’ them into the right format for analysis
- Programming Basics: You’ll learn to use general programming features like ‘if-else’, and ‘for loop’ commands, and write your own functions to perform various operations on datasets.
This course is the first course of the Data Science Professional Certificate. If you’re willing to put in time, money, and effort, it’ll be worth it, especially since it’s created by Harvard.
| Institution | Harvard University |
| Provider | edX |
| Instructor | Rafael Irizarry |
| Prerequisites | None |
| Workload | 8–16 hours |
| Enrollments | 860K |
| Ratings | 4.5/5.0 (93) |
| Cost | Free-to-Audit |
| Exercises | Interactive coding exercises, assessments, and quizzes |
| Certificate | Paid |
Best Free Introductory Book for R and RStudio (Alex Douglas)
If you prefer reading, Alex Douglas’s An Introduction to R is a more up-to-date introduction to R and RStudio for complete programming beginners.
Originally written for undergraduate and postgraduate biostatistics students at the University of Aberdeen, this free online book aims to help you climb the initial learning curve and provide you with the experience and confidence needed to explore R on your own.
You won’t learn how to use R merely by reading a book; you need to practice. Thus, the course’s companion website provides exercises with solutions and ‘how-to’ videos for you to practice writing R code.
- Getting started with R and RStudio: Installation and orientation of R & RStudio. You’ll explore the best way to work with an R project
- Some R basics: How to perform basic R tasks, such as creating objects and assigning values to objects, exploring different types of objects, and performing operations on them
- Data in R: You’ll learn how import a dataset, understand the main data types in R, manipulate and summarize data, and export your results to an external file
- Graphics with base R: Plotting is an important component of data analysis. You’ll study R’s base graphics systems to produce plots
- Graphics with ggplot: You’ll learn the second-most popular R library, ggplot2. You’ll systematically create graphs and charts by combining basic building blocks like data, visual elements, and coordinate systems
- Simple Statistics in R: You’ll become acquainted with many of R’s statistical functions.
- Programming in R: Make R code bend to your will with a deep dive on functions, conditional statements, logical operators, and loops
- Reproducible reports with R markdown: Facilitate open science by creating reproducible reports, just like the book
- Version control with Git and GitHub: Keep track of changes and collaborate with colleagues or the wider world with version control.
| Provider | Independent |
| Authors | Alex Douglas, Deon Roos, Francesca Mancini, Ana Couto & David Lusseau |
| Prerequisites | None |
| Workload | N/A |
| Cost | Free |
| Exercises | On the website |
| Certificate | None |
Best Free Interactive Tutorials for R (swirl)
There are two parts to learning R: the programming language itself and the RStudio IDE.
In this series of free interactive tutorials, you’ll solely focus on improving your R programming skills without RStudio.
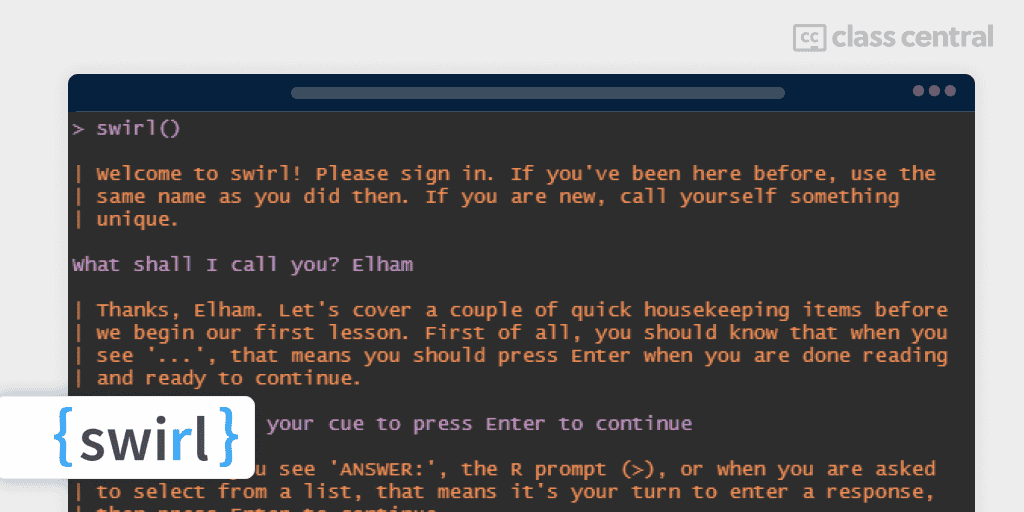
Recommended often to beginners, swirl is an R package that teaches you R from within R. How? It turns the terminal (R Console) into an interactive learning environment. You’ll step-by-step learn 100% through hands-on coding — no prior knowledge of programming needed!
You can either do this course from an R installation on your local machine or online in the browser with Posit Cloud.
There are five official modules by the swirl team + other community-made modules. I’ll list the official modules here:
- R Programming: Start here! You’ll learn the basics of programming in R, including the tools needed for data science and analysis
- Getting and Cleaning Data: You’ll work with three tidyverse libraries, dplyr, tidyr, and lubridate to help you in this process. By the end, you’ll be able to manipulate, group, and chain data with dplyr, tidy data with tidyr, and deal with datetimes with lubridate
- Regression Models: The basics of regression modeling in R. You’ll learn about residuals, multivariable regressions, overfitting and underfitting, among others
- Statistical Inference: Closely mirroring the Johns Hopkins’s Statistical Inference, this module introduces the student to basic concepts of statistical inference including probability, hypothesis testing, confidence intervals and p-values
- Exploratory Data Analysis: How to investigate and summarize the main characteristics of a dataset. Topics covered include plotting with ggplot2, Hierarchical and K Means clustering, and dimension reduction.
| Institution | swirl |
| Prerequisites | None |
| GitHub Stars | 4.2K |
| GitHub Forks | 7.2K |
| Workload | Self-paced |
| Cost | Free |
| Exercises | Interactive coding examples |
| Certificate | None |
Best Free Introductory Book for Data Science (Hadley Wickham)
R for Data Science (shortened to R4DS) is the book for beginners interested in doing data science with R. This book has such a huge following to the point that there’s even a massive R book club named after it, with over 17,000 members. If you had to choose only one resource in this guide, you can’t go wrong with this pick.
R4DS dives straight into the practical skills and knowledge essential for data science. You’ll learn how to import data into R, structure it effectively, transform it into the right format, and create insightful visualizations (solutions to exercises here). Along the way, you’ll also absorb best practices for data cleaning, plotting, and other common tasks in the R ecosystem.
And since R4DS is written by the Chief Scientist at RStudio and lead developer of the tidyverse (the most popular collection of R packages for data science), expect to learn a whole lot about its libraries: ggplot2, dplyr, readr, tidyr, to name a few.
Here’s how the book is structured:
- Whole Game:
- You’ll get a rough overview of the whole game of data science — visualization, transforming, tidying, and importing
- Visualize:
- You’ll dive deep into the art of data visualization: graphs. You’ll also learn how to perform Exploratory Data Analysis (EDA) and how to communicate your understanding to others
- Transform:
- Learn about the most important types of variables that you’ll encounter inside a data frame (from numbers to datetimes) and the tools needed to work with them. Also, how to prepare datasets for analysis
- Import:
- Go beyond reading flat text files. You’ll learn how to work with spreadsheets, get data out of databases, work with big data, rectangle hierarchical data, and scrape data from web sites
- Program:
- The R programming concepts you need to know as a data scientist to be efficient and not deficient. It covers important base R functions that you’re likely to see in the wild
- Communicate:
- You’ll learn about Quarto, a tool for integrating prose, code, and results. R4DS is written in it!
I highly recommend that you join the R4DS Bookclub and surround yourself with like-minded individuals to help you get motivated. They hold this all year round, so check the schedule on their website for more information.
And if you’re reading this article before May 26, former Harvard Preceptor David Kane will be holding an 8-week online data science bootcamp using R4DS as a key resource. It’s completely free to take and open to everyone, even highschool students. Registration will close on May 26, so if you want to take live classes make sure to sign up quickly!
| Institution | O’Reilly Media |
| Provider | Independent |
| Authors | Hadley Wickham, Mine Çetinkaya-Rundel, and Garrett Grolemund. |
| Prerequisites | Basic R programming experience |
| Workload | N/A |
| Rating (Amazon & Goodreads) | 4.6/5.0 (55) 4.6/5.0 (1.1K) |
| Cost | Free |
| Exercises | Coding exercises |
| Certificate | None |
Best Free Rigorous Course for Machine Learning (Stanford University)
An Introduction to Statistical Learning (ISLR) is one of the most popular textbooks providing a comprehensive introduction to the field of statistical learning, also known as machine learning. It’s a whopping ≈600 pages thick, uses real-world case studies with labs, has over a hundred math and coding exercises (community solutions here), and is somehow freely available online!
ISLR has been touted by data scientists, data analysts, and machine learning specialists as a must-read, even if you won’t use most of the techniques described. Why? Because the rock-solid mathematical foundation and a wide variety of perspectives and tools the book gives you will help you solve any analytical work thrown your way.
And while the math covered in this book can be deep, it doesn’t require a PhD to fathom its contents: college-level mathematics and some R programming experience should suffice (in fact, this book is actually a condensed version).
But if opening a math textbook drudges up memories you’d rather forget, I recommend you take the free-to-audit edX companion course led by two core authors of the book, Trevor Hastie and Robert Tibshirani. It essentially summarizes the dense textbook in an applied manner, while also being fairly engaging to watch thanks to Hastie and Tibshirani’s great sense of humor. Of course, you should also read the book alongside.
Here’s a very brief overview of what you’ll cover in this 11 weeks, 3–5 hours a week course:
- Statistical Learning: Techniques for understanding and modeling complex datasets, with an introduction to R
- Linear Regression: Modeling the relationship between variables using a linear equation
- Classification: Assigning data points to predefined categories or classes and their various techniques
- Resampling Methods: Techniques like cross-validation and bootstrapping to assess model performance
- Linear Model Selection and Regularization: How to select important features and prevent overfitting in linear models
- Polynomial Regressions, Splines, and GAMs: Flexible regression methods for modeling non-linear relationships
- Tree-Based Methods: Decision trees and random forests for both regression and classification, and when to use them
- Support Vector Machines: Finding the optimal boundary between classes in high-dimensional space
- Deep Learning: Neural network models with many layers for learning complex patterns in data
- Survival Analysis and Censored Data: How to analyze time-to-event data where some observations are incomplete
- Unsupervised Learning: Finding structure and patterns in data without predefined labels or outcomes
- Multiple Testing: Techniques for controlling the false discovery rate when conducting many hypothesis tests.
| Institution | Stanford University, University of Washington, Emory University |
| Publisher | Springer Texts in Statistics |
| Authors | Gareth Jame, Daniela WItten, Trevor Hastie, Robert Tibshirani |
| Prerequisites | Introductory courses in statistics or probability, linear algebra, and computer programming |
| Workload | 33–55 hours |
| Enrollments | 91K |
| Rating | 4.6/5.0 (24) |
| Cost | Free |
| Exercises | Math and coding exercises, labs, quizzes |
| Certificate | None |
Best Free Introductory Book for Statistics & Probability (Danielle Navarro)
Did the contents of the last course fly over your head? Here’s a much gentler place to start.
Learning statistics with R is a free book that covers the content typically taught in introductory statistics courses for undergraduates in various fields, such as psychology. You’ll learn statistical concepts and how to practically apply them (on real-world datasets and examples) using the R programming language.
This book also teaches the basics of R programming, but there are better courses available.
Some of the things you’ll learn in this course includes:
- Why statistics is important to research
-
- Summarize and describe data using numbers and plotting them with graphs
- Basic probability theory including binomial, normal, and other distributions
-
- Select a representative subset of data from a population by sampling
- Test claims or assumptions about data with hypothesis testing
- Compare means between two groups with t-tests
- Linear regression and its usefulness in exploring relationships between variables
- Compare means across three or more groups with Analysis of Variance (ANOVA)
- How Bayesian statistics allows us to update beliefs about data based on new evidence.
PS: I recommend that you follow the R4DS Book Club’s discussion of this book here for an up-to-date visual learning experience.
| Provider | Independent |
| Author | Danielle Navarro |
| Prerequisites | Highschool mathematics |
| Workload | N/A |
| Cost | Free |
| Exercises | Code examples |
| Certificate | None |
Best Free Course for Data Analysis & Statistics (Richard McElreath)
Statistical Rethinking is a free statistics course for people who don’t want to take a statistics course.
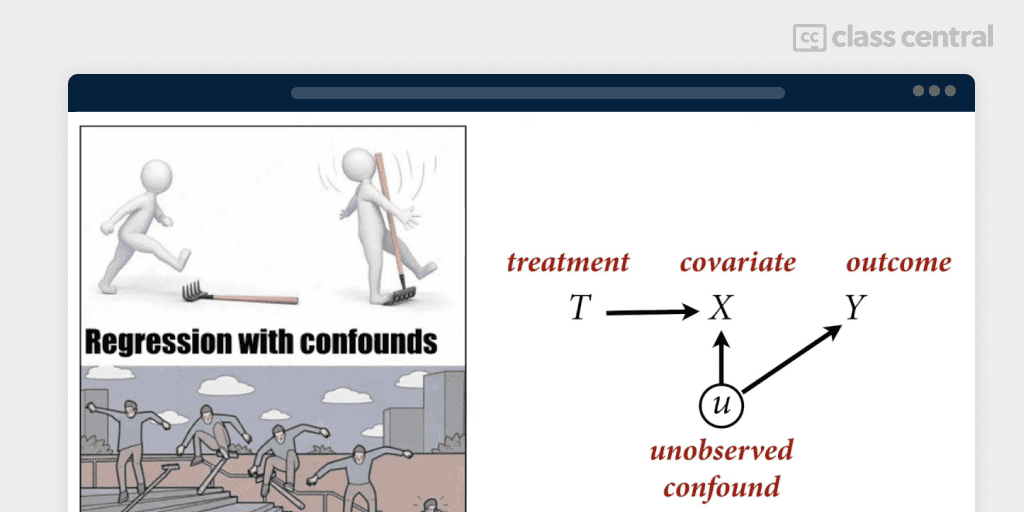
Specifically, you’ll learn how to develop statistical models to connect data to scientific theories and explain patterns in natural phenomena. McElreath, the instructor, approaches this from a Bayesian perspective, favoring causal modeling with directed acyclic graphs over the traditional null hypothesis (see p-hacking).
Now, if you’re a beginner, those words you’ve just read may sound scary, but McElreath actually does an excellent job at explaining the concepts in an accessible way by understanding algorithms more in terms of code than formal math. Plus, he somehow manages to weave an engaging story-like narrative using case studies and allegories, also making it a good read for experienced practitioners looking to build intuition.
Some of the things you’ll take away from this course include:
- Bayesian statistics and how to apply Bayesian methods in practice
- Probabilistic models and how to build them to represent scientific hypotheses
- The limitations of null hypothesis significance testing and p-values
- Directed acyclic graphs (DAGs) and how to use them to express causal assumptions and justify statistical models
- Markov chain Monte Carlo (MCMC) methods for approximating posterior distributions
- Model comparison using information criteria like (Watanabe–Akaike information criterion) WAIC
- Multilevel models for analyzing data with hierarchical structure
- Gaussian processes for modeling nonlinear relationships
- Generalized linear models like binomial regression and Poisson regression for modeling count data and proportions
- How to fit and interpret models using R and Stan.
McElreath holds live classes at the start of each year (342 people signed up for the 2024 session). He uses his paid textbook of the same name (book review here). I recommend that you also go through the textbook while taking the course, as the course doesn’t replace the textbook, or if you can, join a bookclub. Coding exercises are available, and you can find solutions in R, Python, and Julia on the course’s GitHub repository.
| Publisher | Chapman and Hall/CRC |
| Instructor | Richard McElreath |
| Prerequisites | R Programming Experience |
| Workload | 25–26 hours |
| Views | 140K |
| Cost | Free |
| Exercises | Coding exercises with solutions |
| Certificate | None |
Best Paid Learning Platform (DataCamp)
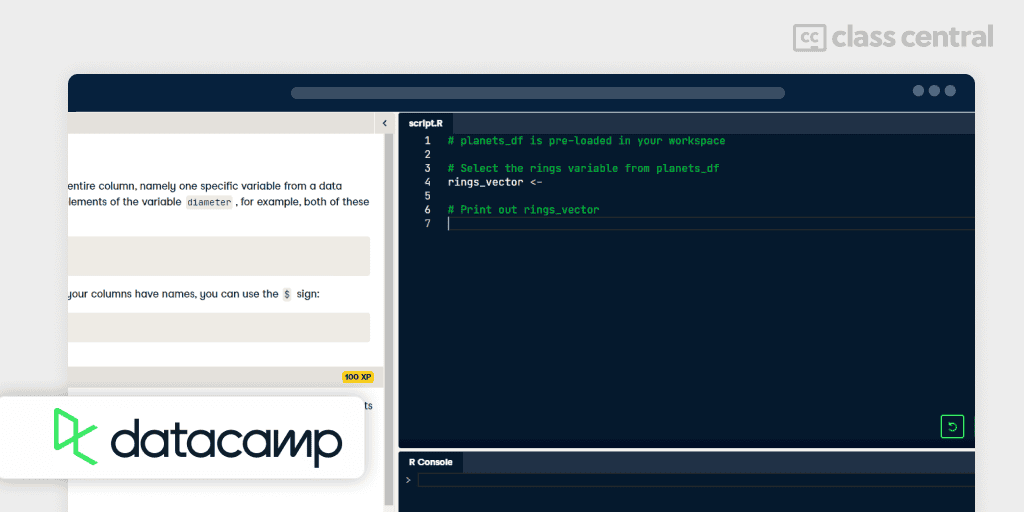
DataCamp offers a similar interactive learning experience to swirl, but it’s much more beginner friendly, since everything from lessons to exercises are all done in the browser — no setup required.
I have a DataCamp subscription, and I have to say that they’ve done a fantastic job at making their video lectures engaging by featuring real-world case studies. I’d see how statistical methods introduced were used to extract insights from data, and then I’d apply them myself through their hands-on exercises. It made me feel like I could have done it too!
However, I did find myself falling into tutorial hell by endlessly doing courses without reflection. Luckily, DataCamp has skills assessments that track your knowledge and projects, case studies, and competitions where you can practice what you’ve learned by coding.
All of DataCamp’s courses are locked behind a paid subscription, but they do offer a free account to take the first chapter of every course. Here are some of their courses so you could try and see if DataCamp suits your style:
- Introduction to R: For beginners with zero programming experience
- Introduction to the Tidyverse: Exploring the Tidyverse packages and what they have to offer
- Introduction to Statistics in R: Learn how to use statistics to draw accurate conclusions from data with R
- Intermediate R: Level up your R skills by learning about conditional statements, loops, and vector functions.
There are also career tracks that come with certificates of completion that basically teach you everything you need to know to become one, such as Data Analyst, Statistician, Machine Learning Scientist, or Associate Data Scientist.
You can get a 3-month trial to DataCamp if you have a GitHub Student Developer Pack (how I started out) or a Visual Studio subscription.
| Institution | DataCamp |
| Prerequisites | None |
| Workload | N/A |
| Cost | Paid |
| Exercises | Interactive in-browser coding exercises |
| Certificate | Paid |
Best Free Introductory Book for Machine Learning (Max Kuhn and Julia Silge)
Tidy Modeling with R is one of the best free introductions to building machine learning models, especially if you’re deep in the tidyverse.
Recommended by R4DS, this book will show you how to produce high-quality statistical and machine learning models using the tidymodels package. You’ll develop good methodology and statistical practices by following the tidyverse approach (clean, high-level, and reproducible).
There are four major chapter headings in this book:
- Introduction: Reviews the fundamentals of machine learning models, base R, and tidyverse R
- Modeling Basics: Focusing on a house prices dataset, you’ll explore the modeling workflow, from splitting, to fitting with parsnip, to feature engineering with recipes, and finally evaluating effectiveness
- Tools for Creating Effective Models: How to assess model performance without using the test set? Continuing with house prices dataset, you’ll learn about resampling, grid and iterative search, and be aware of the overfitting trap
- Beyond the Basics: Covers more advanced modeling concepts, such as dimensionality reduction, model interpretation and assessing model trustworthiness, and ensembles.
If you already know some ML, or want a more rigorous approach, then Stanford’s ISLR would be a better fit for you.
| Institution | O’Reilly Media |
| Provider | Independent |
| Authors | Max Kuhn and Julia Silge |
| Prerequisites | Some R programming and statistical experience, but no machine learning experience |
| Workload | N/A |
| Rating (Amazon & Goodreads) | 4.7/5.0 (50) & 4.5/5.0 (28) |
| Cost | Free |
| Exercises | Code examples |
| Certificate | None |
Best Free Book for Data Visualization (Winston Chang)
Data analysts love graphs for a good reason: they leverage the brain’s strong pattern recognition capabilities. Complex datasets can be transformed into visual stories ripe for uncovering insights, trends, and relationships.
However, finding a great, intuitive visualization for what you want to communicate can be difficult. That’s where Winston Chang’s R Graphics Cookbook comes in.
This free practical guide will help you discover effective visualizations to tell your data story. Containing over 150 code recipes, you’ll be able to easily generate compelling, professional-looking graphics without having to comb through all the details of R’s graphing systems. It assumes some basic knowledge of R, but the recipes are self-contained and easy to follow.
You’ll learn:
- How to create interactive and animated graphs using R tidyverse packages like ggplot2 and dplyr
- Recipes for creating common types of graphs, such as bar charts, line charts, scatterplots, and more
- The grammar of graphics needed to control the overall appearance
- Tips on how to use color, shape, and other aesthetic elements effectively in graphs.
Want to support the author? Buy a physical copy on Amazon here.
| Publisher | O’Reilly Media |
| Provider | Independent |
| Author | Winston Chang |
| Prerequisites | Basic R programming experience |
| Workload | N/A |
| Rating (Amazon & Goodreads) | 4.5/5.0 (89) & 4.2/5.0 (298) |
| Cost | Free |
| Exercises | Code recipes |
| Certificate | None |
Best Free Book for Advanced R Programming (Hadley Wickham)
Advanced R is the definitive guide for mastering the R programming language, and to no one’s surprise, it’s written by Hadley Wickham (the author behind R4DS!).
This free book is for intermediate R programmers who want to deepen their understanding of the language with the vocabulary to back it up, as well as non-R programmers who want to understand what makes R different and special.
Five major topics will be covered:
- Foundations of R programming:
- Every building starts with a strong foundation. You’ll study data types, functions, environments, and conditionals in-depth
- Functional programming (FP):
- Learn why FP is a useful tool for data science by using function factories and operators
- Object-oriented programming (OOP):
- R has several object-oriented programming (OOP) systems. You’ll learn the simplest of them (S3), as well as the more rigorous systems (S4 and R6)
- Metaprogramming:
- Learn when to and when not to use metaprogramming. You’ll do a deep dive into the tidy evaluation framework and see how elegant R code can be
- Performance optimization:
- You’ll gain intuition for which operations in R are slow or use a lot of memory, pinpointing bugs and performance bottlenecks by debugging and profiling. What’s more, you’ll also learn enough C++ to help you convert slow R functions to fast C++ equivalents.
Throughout the book, Wickham provides numerous examples and exercises to reinforce the concepts, giving you many opportunities to apply what you’ve learned (solutions here). He also emphasizes the importance of writing clean, efficient, and maintainable code.
The R4DS Book Club has a series of videos on the book.
| Publisher | Chapman and Hall/CRC |
| Provider | Independent |
| Author | Hadley Wickham |
| Prerequisites | Intermediate experience with R or other programming languages |
| Workload | N/A |
| Rating (Amazon & Goodreads) | 4.8/5.0 (161) & 4.6/5.0 (293) |
| Cost | Free |
| Exercises | Coding exercises with solutions |
| Certificate | None |
Best Free Course for Business Analytics (University of Illinois)
If you’re an aspiring business analyst, this free-to-audit course gets you started with business analytics fundamentals and R programming!
Offered by the University of Illinois at Urbana-Champaign, Introduction to Business Analytics with R will turn you into a business analyst capable of transforming data into actionable insights and communicating your findings with others.
You’ll learn:
- Module 1: You’ll understand the interplay between data analytics and business domains, how to obtain actionable insights through the FACT framework, and setup R and RStudio
- Module 2: DataFrames are the building blocks of R. You’ll learn how to import a dataset into one, and manipulate them, and share your results using notebooks and dashboards
- Module 3: Real-world data is messy. You’ll clean and prepare them for analysis, removing any missing data or outliers, with the help of Tidyverse packages
- Module 4: A further exploration of the Tidyverse packages, where you’ll learn to preprocess data for use in visualizations and algorithms.
This course is 4 weeks long with 16 hours worth of videos, reading, exercises, and peer-assignment materials. And if you’re paying for the certification, you’ll also be quizzed at the end of each module to test your understanding.
This course is part of the Business Analytics and Business Data Management and Communication specializations, as well as a Master of Business Administration (iMBA) program.
| Institution | University of Illinois at Urbana-Champaign |
| Provider | Coursera |
| Instructor | Ronald Guymon and Ashish Khandelwal |
| Prerequisites | None |
| Workload | 16 hours |
| Enrollments | 29K |
| Rating | 4.6 / 5.0 (208) |
| Cost | Free-to-Audit |
| Exercises | Quizzes and peer-graded assignments |
| Certificate | Paid |
Best Free Book for Spatial Statistics (Paula Moraga)
Do you study or work in environmental science, business, public health, or any other fields that use geographical data?
Spatial Statistics for Data Science is a free and comprehensive reference that’ll help you utilize R’s spatial analysis tools to inform decision making — from mapping disease risk, to predicting air pollution, modeling species distribution, and more.
Paula Moraga divides the book into four parts, each uncovering the spatial statistics methods and modeling approaches needed to analyze many types of spatial data using R:
- Part I introduces you to different types of spatial data and their related file formats, coordinate reference systems, and R packages (sf and terra) to work with them
- Part II focuses on the analysis of areal data, which refers to outcomes aggregated over areas like municipalities or districts. Key concepts discussed include spatial neighborhood matrices, autocorrelation, and Bayesian spatial models
- Part III centers around geostatistical data, which are spatially continuous measurements. You’ll study spatial interpolation methods such as inverse distance weighting, Kriging, and model-based geostatistics, and in the end, evaluate their predictive performance using cross-validation
- Part IV deals with spatial point patterns: sets of point locations following some spatial process (think tree locations or disease addresses). It explains the theory of spatial point processes and statistical analysis of point patterns.
The book contains many public health, environment and business-related case studies where you’ll learn how to apply the techniques in the real-world.
The R4DS Book Club has a series covering this book.
| Publisher | Chapman and Hall/CRC |
| Provider | Independent |
| Author | Paula Moraga |
| Prerequisites | Basic R programming experience and good understanding of statistics |
| Workload | N/A |
| Cost | Free |
| Exercises | Code examples |
| Certificate | None |
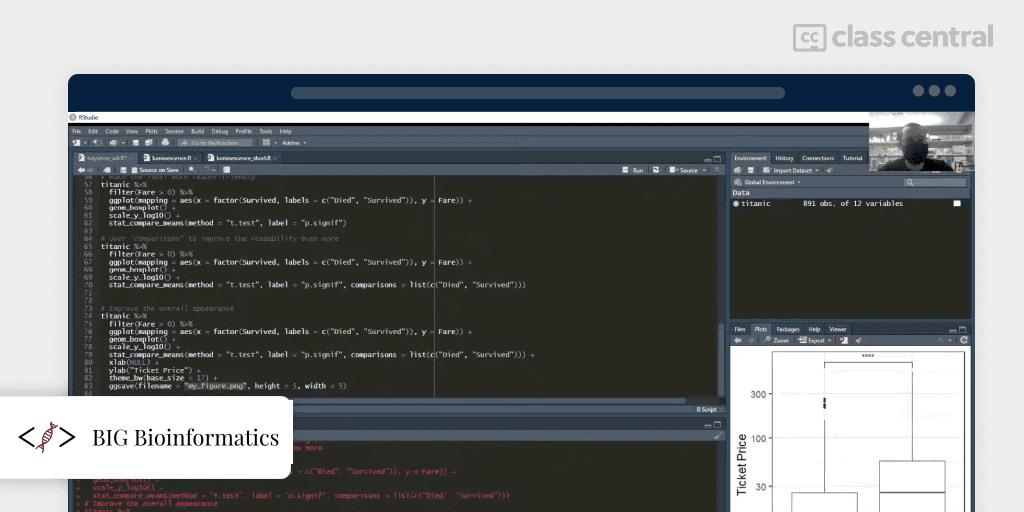
Best Free Course for Biologists (BIG Bioinformatics)
Are you a biologist or bioinformatician? This free introductory workshop to R was specifically designed for you!
You’ll learn fundamental R programming techniques that you can apply in biology research, as well as get acquainted with popular libraries used by biologists, such as the tidyverse packages.
R for Biologists’s homeworks are the interactive lessons on DataCamp. If you have a DataCamp subscription, you should follow along.
The course is structured into 6 weeks, and you’ll learn:
- Orientation and Setting up R: Introduction to R and RStudio, where you’ll write your first “Hello, World!” program
- Data structures in R: The main data types in R are characters, numerics, integers, logicals, while the main data structures are vectors, and lists. You’ll learn how to work with them
- Fundamental programming concepts in R: Data frames allow data to be organized into rows and columns like an Excel sheet. You’ll learn how to manipulate and analyze them with functions, conditional statements, and loops
- Review week: The course demonstrates various functions, such as max, mean, and apply, as well as other programming concepts you’ve learned in the last lesson
- The Tidyverse: You’ll explore the tidyverse, a suite of R packages for easy data manipulation, visualization, and analysis. You’ll apply them on a Titanic passenger data set
- R for biological data science: Finally, you’ll use R for biological data analysis by importing data from a plate reader experiment, normalizing the luminescence values, and performing statistical tests to compare the means between experimental groups.
| Institution | BIG Bioinformatics |
| Provider | Independent |
| Instructors | Henry Miller, Aiola Stoja, and Simon Levy |
| Prerequisites | None except for knowledge of statistics |
| Workload | 8–9 hours |
| Views | 11K |
| Cost | Free |
| Exercises | DataCamp exercises |
| Certificate | None |
Best Free Book for Economic/Econometrics (Christoph Hanck)
Econometrics combines mathematical and statistical methods to analyze economic data, allowing economists to conduct, simulate, document, and communicate empirical studies. And their preferred tool for doing so is R.
However, many economics students have not been exposed to programming before and struggle to learn R on their own. Introduction to Econometrics with R aims to relieve them.
And rather than just teaching coding, this free book blends R code with the contents of the similarly named textbook Introduction to Econometrics by Stock and Watson so that students can replicate famous case studies in R while strengthening their programming skills. And all of this can be done right in the browser, thanks to DataCamp’s interactive learning widget!
Thus, undergraduate students will find this book published by University of Duisburg-Essen to be a great fit in their economics studies.
| Institution | University of Duisburg-Essen |
| Provider | Independent |
| Authors | Christoph Hanck, Martin Arnold, Alexander Gerber, and Martin Schmelzer |
| Prerequisites | None |
| Workload | N/A |
| Cost | Free |
| Exercises | Interactive in-browser coding exercises and case studies |
| Certificate | None |
Why You Should Trust Us
Class Central, a Tripadvisor for online education, has helped 60 million learners find their next course. We’ve been combing through online education for more than a decade to aggregate a catalog of 200,000 online courses and 200,000+ reviews written by our users. And we’re online learners ourselves: combined, the Class Central team has completed over 400 online courses, including online degrees.
Best Courses Guide (BCG) Methodology
I built this ranking following the now tried-and-tested methodology used in previous BCGs (you can find them all here). It involves a three-step process:
- Research: I started by leveraging Class Central’s database and the internet. Then, I made a preliminary selection of 900+ R courses by rating, reviews, and bookmarks. I also selected helpful books.
- Evaluate: I read through reviews on Class Central, Reddit, and course providers to understand what other learners thought about each resource and combined it with my own experience as a learner.
- Select: Well-made courses and books were picked if they presented valuable and engaging content, and fit a set of criteria including comprehensive curriculum, affordability, release date, ratings and enrollments.


Jim
@Elham, I don’t know anything about R. But I’d be interested if there’s any course that teaches developers of other languages to READ (and not to write) R. Thanks.